Python中matplotlib的基本使用
01.简介
基本上每门计算机语言都可以绘制图像,在科学计算中matlab、R的绘图能力是非常强大的。但是对于挚爱python的程序员说,python绘图图形也还是不错的。当然这里你需要知道一些最基本的知识,数据处理的numpy,一句numpy的matplotlib包,在这几个环境准备好了,可以尝试编写一些基本的图形了。
这里需要补充的是安装numpy和matplotlib在window系统中,dos窗口:pip install numpy ;pip install matplotlib;即可。
02.绘图基本介绍
这里是以代码展示的,具体可以对照代码详看:
import matplotlib.pyplot as plt
import numpy as np
x=np.linspace(-3,3,50) #-3 --3 50个点
y1=x*2+1
y2=x**2
#第一张figure,一下都是其内容
plt.figure("第一个图") #为该figure设置参数
plt.plot(x,y1)
#第二张figure
plt.figure("第二个图")
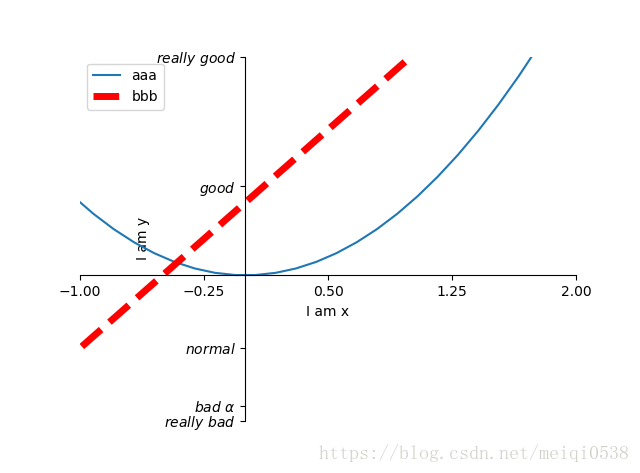
l1,=plt.plot(x,y2,label='up') #为曲线设置标签
l2,=plt.plot(x,y1,color='red',linewidth=5.0,linestyle='--',label='down')
#图例设置,曲线设置label
#r如果想打印一条如:l1,可以handles=[l1],label=['aaa',]
plt.legend(handles=[l1,l2,],labels=['aaa','bbb'],loc='best')
#给坐标轴设置范围
plt.xlim((-1,2))
plt.ylim((-2,3))
#设置坐标参数
plt.xlabel("I am x")
plt.ylabel("I am y")
#设置角标
new_ticks=np.linspace(-1,2,5) #5个点
print(new_ticks)
plt.xticks(new_ticks)
#y轴对应值设置,使用$设置字体, a $\alpha
plt.yticks([-2,-1.8,-1,1.22,3], [r'$really\ bad$',r'$bad \ \alpha$',r'$normal$',r'$good$',r'$really\ good$'])
#设置坐标轴的位置
ax=plt.gca() #获取坐标轴对象
#设置上右轴为none
ax.spines['right'].set_color('none') #四个边框
ax.spines['top'].set_color('none')
#将原图的左、下边框设置坐标轴对象的左、下边框
ax.xaxis.set_ticks_position('bottom')
ax.yaxis.set_ticks_position('left')
#挪动边框,设置坐标原点
ax.spines['bottom'].set_position(('data',0))
ax.spines['left'].set_position(('data',0))
#把所有的数据显示
plt.show()