1 手机和电脑用数据线连接
使用通过数据线连接手机,将开发者模式打开并授权
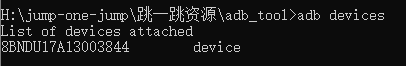
通过adb命令
| adb devices |
可以查看连接的Android设备的信息
2 获取手机相关的信息
通过如下命令可以查看连接电脑的Android手机相关的信息
| adb shell dumpsys window displays |

Ps:在第4行可以看到手机的分辨率
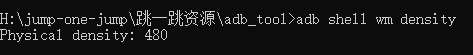
获取屏幕密度
| adb shell wm density |
获取手机型号
| adb shell getprop ro.product.device |

获取Android系统的版本
| adb shell getprop ro.build.version.release |

3 截屏
输入如下命令:
| adb shell screencap -p /sdcard/auto.png |
此时,截屏的图片就保存到 /sdcard/auto.png文件中。
注意:/sdcard/和/data/目录是可以写入的。
可以通过命令
| adb shell ls /sdcard/ -l |
查看sdcard目录下所有的文件。
通过如下命令把手机上的文件拷贝到电脑上
| adb pull /sdcard/auto.png h:\ |
此时,图片就会被拷贝到h:\根目录下了。打开即可看到当前手机的屏幕信息。
4 屏幕点击事件
通过如下命令模拟手机的滑动事件
| adb shell input swipe x1 y1 x2 y2 duration |
通过adb shell input swipe命令进行滑动
l x1、y1:滑动开始的点。
l x2、y2:滑动结束的点。
l duration:持续的时间(单位ms)。
特殊情况下:如果不写duration参数,就理解为点击事件。如果写duration,然后x1y1和x2y2是相同的点,就表示长按。
跳一跳关键是:duration的值的计算。
尝试:
| adb shell input swipe 100 100 100 100 700 |
尝试修改duration的值,看看跳的效果。
求得可以拿到加分的中间值。比如555~871都可以拿到加分(555以下和871以上就不能拿到加分),此时则取中间值为(555+871)/2=713 作为后面计算的参考值。
5 duration值的计算
假设我们截屏的效果是如下:

从图中可以看到,时间的值跟开始位置到结束位置的距离有关。
假设时间是t,距离是s。公式应该是s = at
基本思路:两点之间的距离乘以一个时间系数。
所以要从截图上识别出起跳位置的坐标(x1,y1)和目标位置的坐标(x2,y2)。
起跳位置的坐标:小人的底座中心点
目标位置的坐标:目标菱形的中心点
然后计算这两点之间的距离(欧氏距离):sqrt((x1-x2)2+(y1-y2)2)
6 截屏的代码
创建img目录,后面把所有截屏的图片都放到该目录下(原则上每跳一步都需要截屏一次)
operation.py
import os |
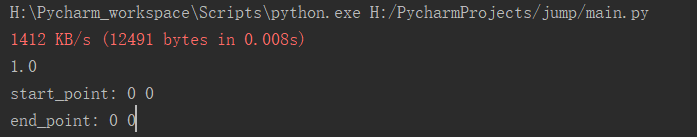
main.py
from .operation import * |
# 测试截屏 |
7 显示图片的代码
需要安装matplotlib库
| pip install matplotlib |
需要安装opencv的库
| pip install opencv-python |
draw.py
import matplotlib.pyplot as plt # 绘图 |
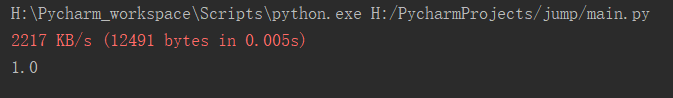
main.py
# 测试显示图片 |

8 计算两点之间的欧氏距离
创建文件algorithm.py文件,添加计算欧氏距离的方法
algorithm.py
# 算法类 |
main.py
|
9 寻找关键坐标——框架
关键是查找起跳点的坐标和目标点的坐标。
在algorithm.py中添加方法find_point()
# 寻找关键坐标 |
main.py
# 测试寻找关键坐标 |