KNN算法是监督学习分类方法。何为监督学习?我们用来训练的数据集应当包括数据特征和标签两个部分,通过训练建立数据特征和标签之间关系的算法模型,这样的话,将测试数据集套用算法模型,可以得到测试数据的标签。
一 KNN算法原理
在训练样本集中每个数据都存在标签,即我们知道样本集中每一数据与所属分类的对应关系。输人没有标签的新数据后,将新数据的每个特征与样本集中数据对应的特征进行比较,然后算法提取样本集中特征最相似数据(最近邻)的分类标签。选择k个最相似数据中出现次数最多的分类,作为新数据的分类。在KNN中,通过计算对象间距离作为各个对象之间的相似性指标,代替对象之间的匹配度计算。
对于训练样本数为m,特征数为n的训练样本集,计算测试样本x与m个训练样本的欧氏距离
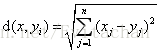
其中i=1,2,……,m。对d(x,yi)进行降序排列,选择前k个值,出现次数最多的分类作为测试样本x的分类。
形象地理解,将训练样本和测试样本投影到n维空间上,以某个测试样本为中心,距离其最近的k个训练样本点采用投票原则,投出该训练样本的标签。
由此可见,k值的选择会影响到标签的决策。以iris数据集为例。

数据集中共150个样本点,四个特征,为了绘制散点图,选取前两个特征进行分类。
import numpy as np
import matplotlib.pyplot as plt
from sklearn import neighbors

# import some data to play with
from sklearn import datasets
iris = datasets.load_iris()

# only take the first two features.
# we could avoid this ugly slicing by using a two-dim dataset
x = iris.data[:, :2]
y = iris.target

# k
n_neighbors = 3

# create color maps
from matplotlib.colors import ListedColormap
cmap_light = ListedColormap(['#FFAAAA', '#AAFFAA', '#AAAAFF'])
cmap_bold = ListedColormap(['#FF0000', '#00FF00', '#0000FF'])

# knn
n_neighbors = 3

for weights in ['uniform', 'distance']:
    # we create an instance of Neighbors classifier and fit the data
    clf = neighbors.KNeighborsClassifier(n_neighbors, weights = weights)
    clf.fit(x, y)

    # plot the decision boundary.
    # For that, we will assign a color to each point in the mesh[x_min, x_max] * [y_min, y_max]
    x_min, x_max = x[:, 0].min() - 1, x[:, 0].max() + 1
    y_min, y_max = x[:, 1].min() - 1, x[:, 1].max() + 1
    xx, yy = np.meshgrid(np.arange(x_min, x_max, .02), np.arange(y_min, y_max, .02))

    # predict
    z = clf.predict(np.c_[xx.ravel(), yy.ravel()])

    # put the result into a color plot
    z = z.reshape(xx.shape)
    plt.figure()
    plt.pcolormesh(xx, yy, z, cmap = cmap_light)

    # plot also the training points
    plt.scatter(x[:, 0], x[:, 1], c = y, cmap = cmap_bold, edgecolor = 'k', s = 20)
    plt.xlim(xx.min(), xx.max())
    plt.ylim(yy.min(), yy.max())
    plt.title("3-Class classification (k = %i, weithts = '%s')" % (n_neighbors, weights))

plt.show()
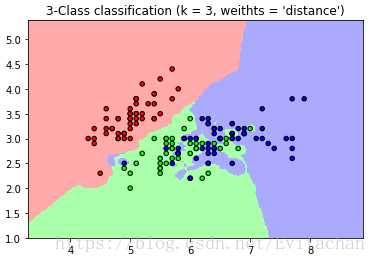
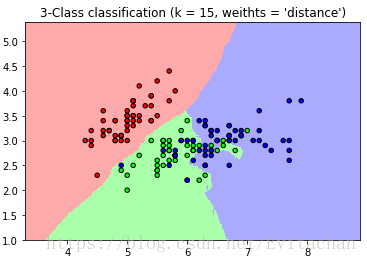
比较两个图,可以很明显看出,当k取值不同时,分类的效果不同。
二 KNN算法预测泰坦尼克沉船遇难情况
原始数据有10个特征,选取特征:‘Pclass’,‘Sex’,‘Age’,‘SibSp’,‘Parch’ 5个作为决策树特征向量。
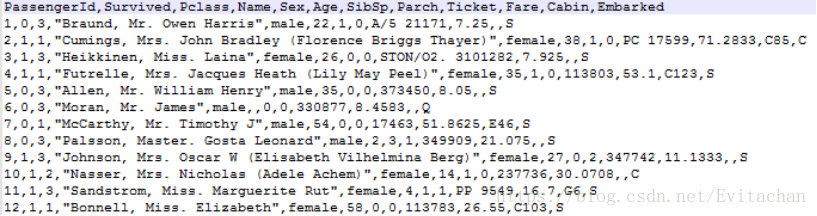
数据预处理
>训练集中共有891位乘客的数据信息,其中277位乘客的年龄数据缺失,余下数据年龄平均值为29.7,用30补全缺失项。
>性别男/女用1/0表示。
from numpy import *
import operator
from os import listdir

def classify0(inX, dataSet, labels, k):
    dataSetSize = dataSet.shape[0]
    diffMat = tile(inX, (dataSetSize,1)) - dataSet
    sqDiffMat = diffMat**2
    sqDistances = sqDiffMat.sum(axis=1)
    distances = sqDistances**0.5
    sortedDistIndicies = distances.argsort()
    classCount={}
    for i in range(k):
        voteIlabel = labels[sortedDistIndicies[i]]
        classCount[voteIlabel] = classCount.get(voteIlabel,0) + 1
    sortedClassCount = sorted(classCount.items(), key=operator.itemgetter(1), reverse=True)
    return sortedClassCount[0][0]

def createDataSet():
    group = array([[1.0,1.1],[1.0,1.0],[0,0],[0,0.1]])
    labels = ['A','A','B','B']
    return group, labels

def file2matrix(filename):
    file = open(filename)
    arraylines = file.readlines()
    numberoflines = len(arraylines) - 1
    returnMat = zeros((numberoflines,3))    #创建行数为numberoflines,列数为2的矩阵
    classLabel = []
    index = 0
    for line in arraylines[1:]:
        line = line.strip()
        lis = line.split(' ')
        returnMat[index,:] = lis[0:3]
        classLabel.append(int(lis[-1]))   #是为1类,否为0类
        index += 1
    return returnMat,classLabel

def autoNorm(dataSet):
    minVals = dataSet.min(0)
    maxVals = dataSet.max(0)
    ranges = maxVals - minVals
    normDataSet = zeros(shape(dataSet))
    m = dataSet.shape[0]
    normDataSet = dataSet - tile(minVals, (m,1))
    normDataSet = normDataSet/tile(ranges, (m,1))   #element wise divide
    return normDataSet, ranges, minVals

def datingClassTest():
    hoRatio = 0.1      #hold out 10%
    datingDataMat,datingLabels = file2matrix('datingTestSet2.txt')
    normMat, ranges, minVals = autoNorm(datingDataMat)
    m = normMat.shape[0]
    numTestVecs = int(m*hoRatio)
    errorCount = 0.0
    for i in range(numTestVecs):
       classifierResult = classify0(normMat[i,:],normMat[numTestVecs:m,:],\
          datingLabels[numTestVecs:m],3)

       str= "the classifier came back with: %d, the real answer is: %d"\
          % (classifierResult, datingLabels[i])
       print(str)
       if (classifierResult != datingLabels[i]): errorCount += 1.0
    str= "the total error rate is: %f" % (errorCount/float(numTestVecs))
    print(str)
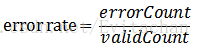
使用交叉验证方法,选取一定比例数据作为测试集,比较利用KNN算法分类所得标签与真实标签结果是否一致,若不一致,则错误样本数加一。最终利用错误样本数除以总验证样本数得到错误率。

三 总结
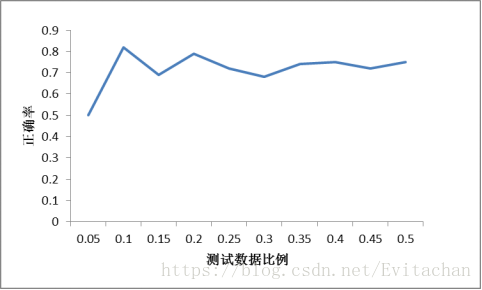
1. 在选取10%数据作为测试数据时分类效果最好,这与最常用的十折交叉验证相符合。
2. k值选择过大或过小都会影响正确率,在使用KNN模型时,我们需要不断调整k值,直到找到局部最优解,这也是KNN算法需要解决的问题。