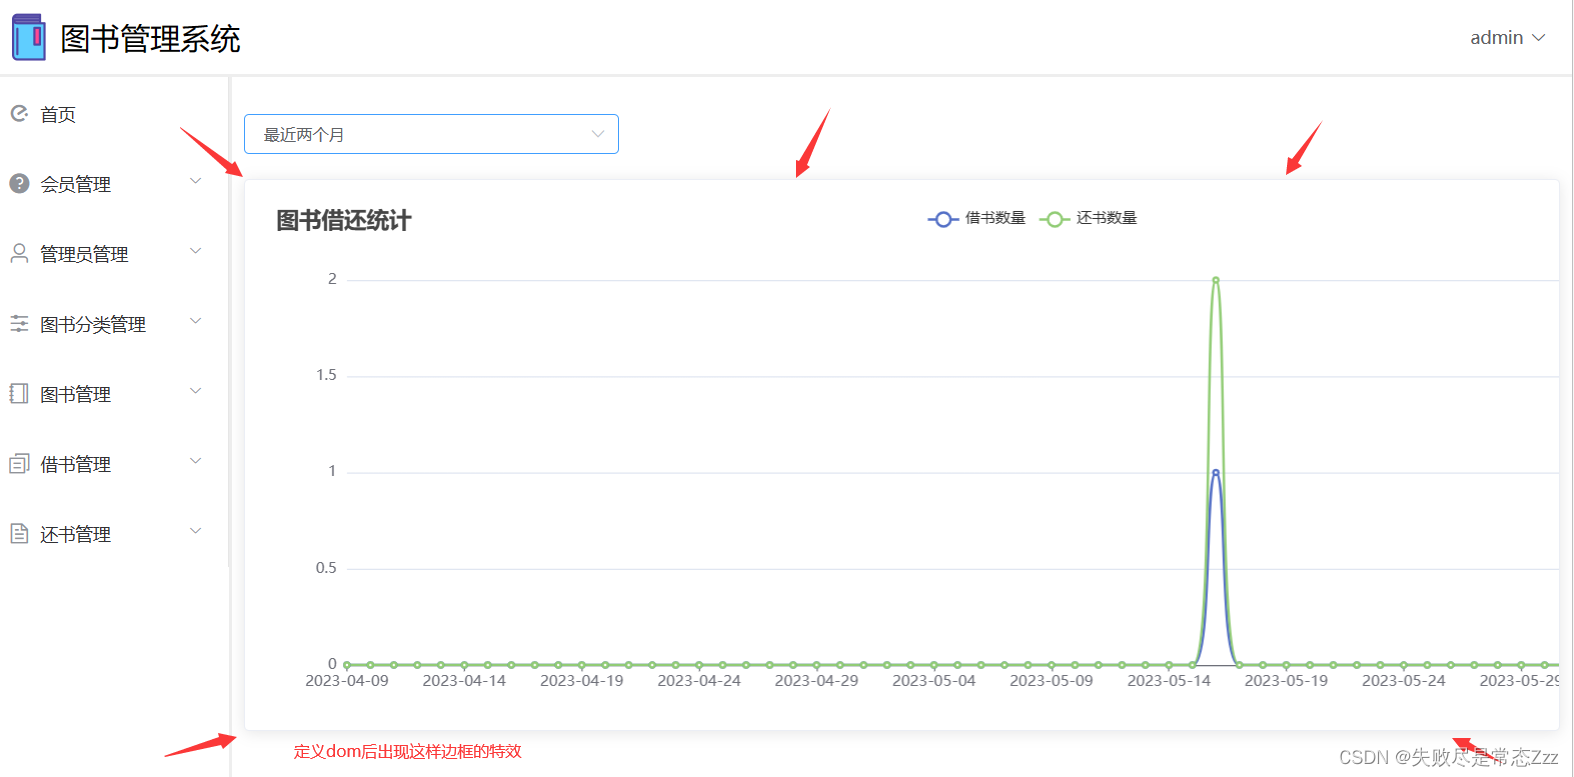
数据可视化
前情提要:本次Echarts数据可视化基于图书管理系统设计
一、Echarts
Echarts是一个开源的可视化图表库,由百度前端技术部开发维护。它基于JavaScript语言实现,通过简单的配置即可生成丰富多样的图表,包括柱状图、折线图、饼图等等。Echarts支持各种数据格式,如JSON、XML、CSV等,同时也提供了强大的交互功能,可以让用户在图表上进行缩放、平移、标记等操作。Echarts还有丰富的扩展插件和主题,方便用户根据不同需求进行自定义定制。Echarts的优点在于使用简单、灵活性高、可定制性强,并且提供了完善的文档和API参考,方便开发人员快速上手和开发。
二、前端(Vue+Echarts)
Echarts下载:npm i echarts -S
HomeView.vue(完整代码)
<template>
  <div>
    <div style="margin: 20px 0">
      <el-select class="input" v-model="timeRange" placeholder="请选择" @change="load">
        <el-option
            v-for="item in options"
            :key="item.value"
            :label="item.label"
            :value="item.value">
        </el-option>
      </el-select>
    </div>
    <el-card>
      <div id="line" style="width: 100%; height: 400px"></div>
    </el-card>
  </div>
</template>

<script>
import Cookies from 'js-cookie'
import request from "@/utils/request";
import * as echarts from 'echarts'

const option = {


  title: {


    text: '图书借还统计'
  },
  tooltip: {


    trigger: 'axis'
  },
  legend: {


    data: ['借书数量', '还书数量']
  },
  grid: {


    left: '3%',
    right: '4%',
    bottom: '3%',
    containLabel: true
  },
  toolbox: {


    feature: {


      saveAsImage: {

      }
    }
  },
  xAxis: {


    type: 'category',
    boundaryGap: false,
    data: []  //从后台动态获取
  },
  yAxis: {


    type: 'value'
  },
  series: [
    {


      name: '借书数量',
      type: 'line',
      stack: 'Total',
      smooth: true,
      data: []    //从后台动态获取
    },
    {


      name: '还书数量',
      type: 'line',
      smooth: true,
      data: []   //从后台动态获取
    }
  ]
}

  export default {


    data() {


      return {


        admin: Cookies.get('admin') ? JSON.parse(Cookies.get('admin')) : {

      },
        lineBox: null,
        timeRange: 'week',
        options: [
          {

      label: '最近一周', value: 'week'},
          {

      label: '最近一个月', value: 'month'},
          {

      label: '最近两个月', value: 'month2'},
          {

      label: '最近三个月', value: 'month3'},
        ]
      }
    },
    mounted() {

        // 等页面元素全部初始化好才开始加载mounth()函数
      this.load()
    },
    methods: {


      load() {


        if (!this.lineBox) {


          this.lineBox = echarts.init(document.getElementById('line'))  //初始化echarts容器
        }
        //从后台获取数据
        request.get('/borrow/lineCharts/' + this.timeRange).then(res => {


          option.xAxis.data = res.data.date
          option.series[0].data = res.data.borrow
          option.series[1].data = res.data.retur
          this.lineBox.setOption(option)  //设置容器的属性值,当数据重新发生变化时,一定要重新setOption()
        })
      }
    }
  }
</script>

<style>
.input {


  width: 300px;
}
</style>
1、导入echarts
import * as echarts from 'echarts'
2、原始的option代码
option = {


  title: {


    text: 'Stacked Line'
  },
  tooltip: {


    trigger: 'axis'
  },
  legend: {


    data: ['Email', 'Union Ads', 'Video Ads', 'Direct', 'Search Engine']
  },
  grid: {


    left: '3%',
    right: '4%',
    bottom: '3%',
    containLabel: true
  },
  toolbox: {


    feature: {


      saveAsImage: {

    }
    }
  },
  xAxis: {


    type: 'category',
    boundaryGap: false,
    data: ['Mon', 'Tue', 'Wed', 'Thu', 'Fri', 'Sat', 'Sun']
  },
  yAxis: {


    type: 'value'
  },
  series: [
    {


      name: 'Email',
      type: 'line',
      stack: 'Total',
      data: [120, 132, 101, 134, 90, 230, 210]
    },
    {


      name: 'Union Ads',
      type: 'line',
      stack: 'Total',
      data: [220, 182, 191, 234, 290, 330, 310]
    },
    {


      name: 'Video Ads',
      type: 'line',
      stack: 'Total',
      data: [150, 232, 201, 154, 190, 330, 410]
    },
    {


      name: 'Direct',
      type: 'line',
      stack: 'Total',
      data: [320, 332, 301, 334, 390, 330, 320]
    },
    {


      name: 'Search Engine',
      type: 'line',
      stack: 'Total',
      data: [820, 932, 901, 934, 1290, 1330, 1320]
    }
  ]
};
3、修改
目录:
text: '图书借还统计
折线:
 legend: {


    data: ['借书数量', '还书数量']
  },
横坐标:
  xAxis: {


    type: 'category',
    boundaryGap: false,
    data: []
  },
纵坐标:
  yAxis: {


    type: 'value'
  },
series(与相应折线legend对应)
series: [
    {


      name: '借书数量',
      type: 'line',
      stack: 'Total',
      smooth: true,
      data: []
    },
    {


      name: '还书数量',
      type: 'line',
      stack: 'Total',
      smooth: true,
      data: []
    }
  ]
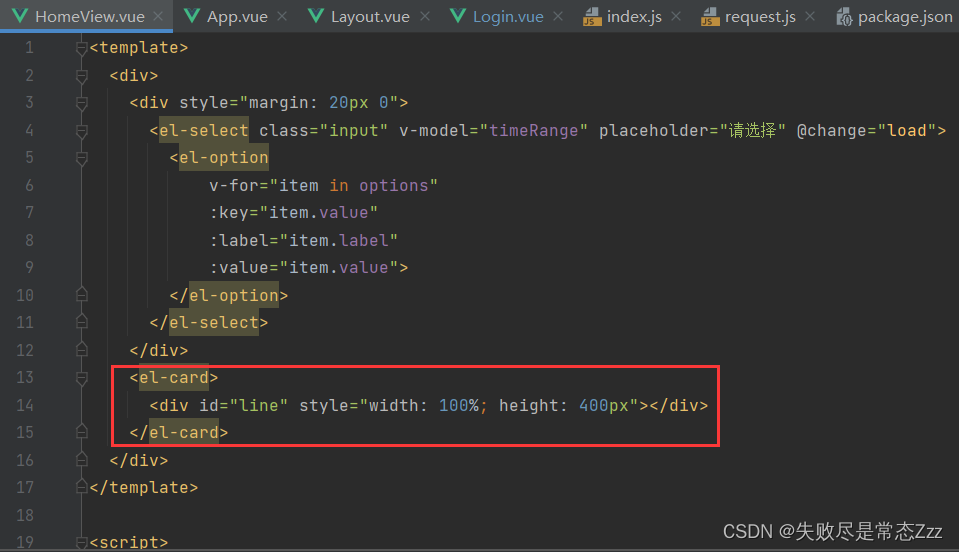
4、定义echart图标对应的dom元素
html
    <el-card>
      <div id="line" style="width: 100%; height: 400px"></div>
    </el-card>
 5、定义echarts容器
js
    data() {


      return {


        lineBox: null,
      }
    }
6、根据时间范围加载最新的数据
html
    <div style="margin: 20px 0">
      <el-select class="input" v-model="timeRange" placeholder="请选择" @change="load">
        <el-option
            v-for="item in options"
            :key="item.value"
            :label="item.label"
            :value="item.value">
        </el-option>
      </el-select>
    </div>
js
    mounted() {

      // 等页面元素全部初始化好才开始加载mounth()函数
      this.load()
    },
    methods: {


      load() {


        if (!this.lineBox) {


          this.lineBox = echarts.init(document.getElementById('line'))  //初始化echarts容器
        }
        //从后台获取数据
        request.get('/borrow/lineCharts/' + this.timeRange).then(res => {


          option.xAxis.data = res.data.date
          option.series[0].data = res.data.borrow
          option.series[1].data = res.data.retur
          this.lineBox.setOption(option)  //设置容器的属性值,当数据重新发生变化时,一定要重新setOption()
        })
      }
    }
三、后端(SpringBoot+MyBatis)
1、请求接口
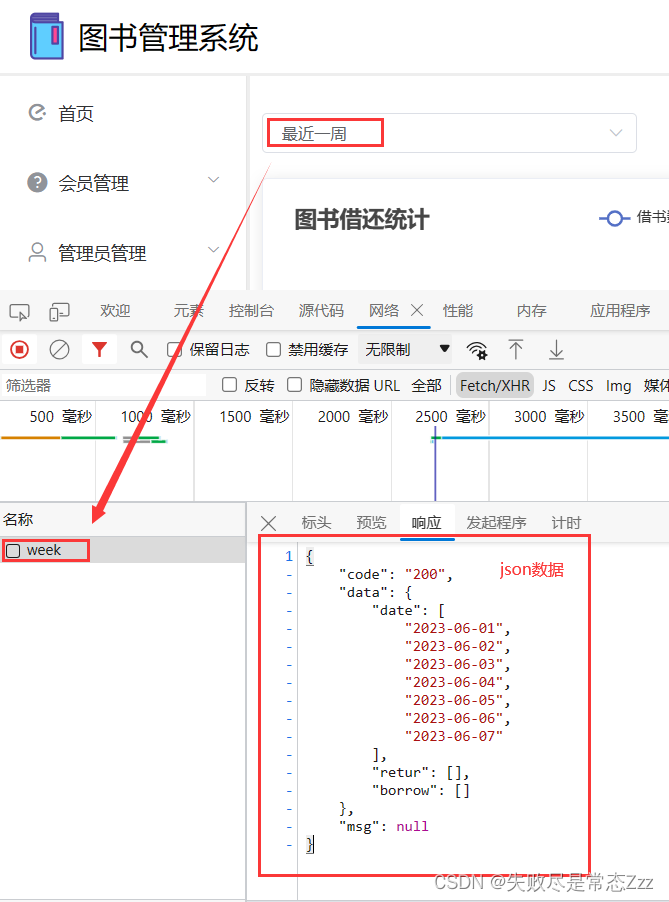
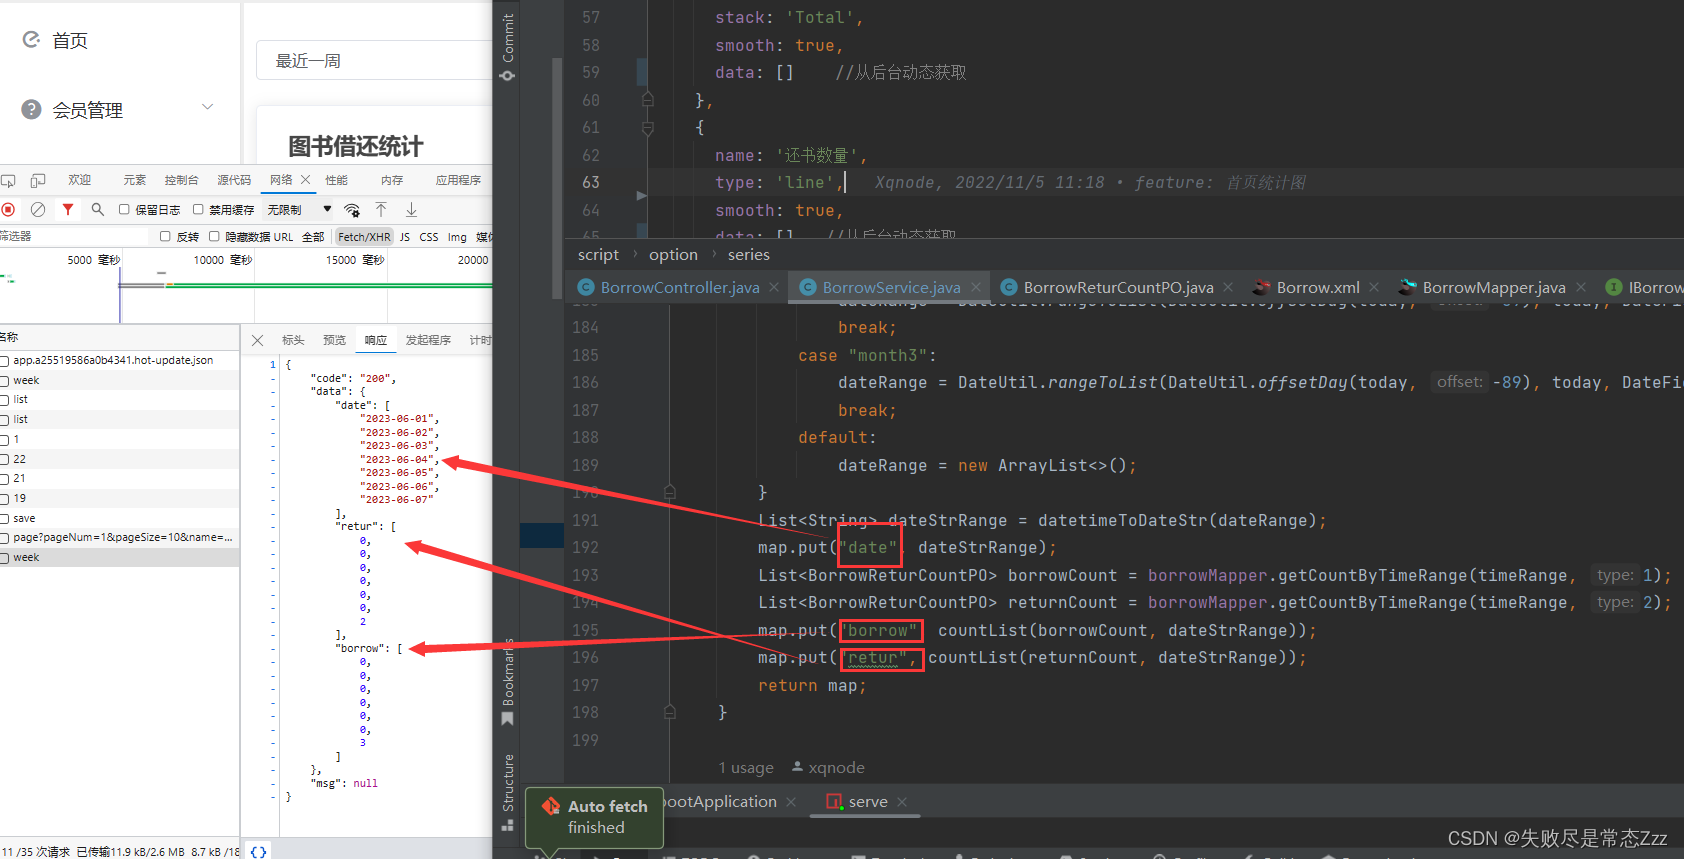
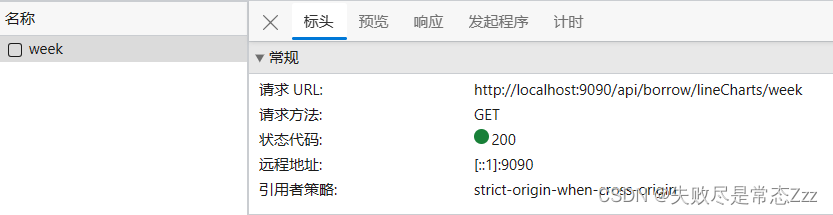 2、返回前端的数据
BorrowController.java
    //timeRange:week、month、month2、month3
    @GetMapping("/lineCharts/{timeRange}")
    public Result lineCharts(@PathVariable String timeRange) {


        return Result.success(borrowService.getCountByTimeRange(timeRange));
    }
IBorrowService.java
Map<String, Object> getCountByTimeRange(String timeRange);
BorrowService.java
导入
import cn.hutool.core.collection.CollUtil;
import cn.hutool.core.date.DateField;
import cn.hutool.core.date.DateTime;
import cn.hutool.core.date.DateUtil;
Java工具类库Hutool 提供的方法:
DateUtil.rangeToList() 返回从开始时间到结束时间的一个时间范围 返回类型 List < DateTime >
DateUtil.offsetDay() 计算时间的一个工具方法 返回类型 DateTime
通过自定义函数 datetimeToDateStr() 把 DateTime类型 的 List 转换成一个 String类型 的 List
原因是前端里 “data”:[ ]、“return”:[ ]、“borrow”:[ ] 数组存储的是String类型的元素
    @Override
    public Map<String, Object> getCountByTimeRange(String timeRange) {


        Map<String, Object> map = new HashMap<>();
        Date today = new Date();
        List<DateTime> dateRange;
        switch (timeRange) {


            case "week":
                dateRange = DateUtil.rangeToList(DateUtil.offsetDay(today, -6), today, DateField.DAY_OF_WEEK);
                break;
            case "month":
                dateRange = DateUtil.rangeToList(DateUtil.offsetDay(today, -29), today, DateField.DAY_OF_MONTH);
                break;
            case "month2":
                dateRange = DateUtil.rangeToList(DateUtil.offsetDay(today, -59), today, DateField.DAY_OF_MONTH);
                break;
            case "month3":
                dateRange = DateUtil.rangeToList(DateUtil.offsetDay(today, -89), today, DateField.DAY_OF_MONTH);
                break;
            default:
                dateRange = new ArrayList<>();
        }
        List<String> dateStrRange = datetimeToDateStr(dateRange);
        map.put("date", dateStrRange); // x轴的时间日期数据生成完毕
        //1 borrow  2 retrun
        //getCountByTimeRange:不会统计数据库没有的日期,比如没有2022.11.4,他不会返回 **data=2022-11-04,count=0**
        List<BorrowReturCountPO> borrowCount = borrowMapper.getCountByTimeRange(timeRange, 1);
        List<BorrowReturCountPO> returnCount = borrowMapper.getCountByTimeRange(timeRange, 2);
        map.put("borrow", countList(borrowCount, dateStrRange));
        map.put("retur", countList(returnCount, dateStrRange));
        return map;
    }
注意:
getCountByTimeRange sql语句:不会统计数据库没有的日期,比如没有2022.11.4,他不会返回 data=2022-11-04,count=0 这个数据,所以又写countList()函数对在统计数据库时其中不存在的数据进行处理
datetimeToDateStr()函数
把 DateTime类型 的 List 转换成一个 String类型 的 List
    private List<String> datetimeToDateStr(List<DateTime> dateTimeList) {


        List<String> list = CollUtil.newArrayList();
        if (CollUtil.isEmpty(dateTimeList)) {


            return list;
        }
        for (DateTime dateTime : dateTimeList) {


            String date = DateUtil.formatDate(dateTime);
            list.add(date);
        }
        return list;
    }
countList()函数
1、对在统计数据库时其中不存在的数据进行处理
2、.map(BorrowReturCountPO::getCount) 取出对象里的count值
3、有就取出,没有就.orElse(0)对没匹配的数据返回 0
    private List<Integer> countList(List<BorrowReturCountPO> countPOList, List<String> dateRange) {


        List<Integer> list = CollUtil.newArrayList();
        if (CollUtil.isEmpty(countPOList)) {


            return list;
        }
        for (String date : dateRange) {


            Integer count = countPOList.stream().filter(countPO -> date.equals(countPO.getDate()))
                    .map(BorrowReturCountPO::getCount).findFirst().orElse(0);
            list.add(count);
        }
       /*    "date": [
                    "2023-06-01",
                    "2023-06-02",
                    "2023-06-03",
                    "2023-06-04",
                    "2023-06-05",
                    "2023-06-06",
                    "2023-06-07"
        ],
            "retur": [
                    0,
                    0,
                    0,
                    0,
                    0,
                    0,
                    2
        ],
            "borrow": [
                    0,
                    0,
                    0,
                    0,
                    0,
                    0,
                    3
        ]*/
        return list;
    }
BorrowReturCountPO(自定义类封装)
@Data
public class BorrowReturCountPO {


    private String date;
    private Integer count;
}
BorrowMapper.java
List<BorrowReturCountPO> getCountByTimeRange(@Param("timeRange") String timeRange, @Param("type") int type); // 1 borrow 2 return
Borrow.xml
1、DATE_FORMAT(createtime,‘%Y-%m-%d’) :把DateTime类型的数据格式化为 yyyy-MM-dd
2、getCountByTimeRange sql语句:如果是1查 borrow表,2查 return表
3、DATE_SUB(NOW(),INTERVAL 1 WEEK) :数据库进行时间计算的函数(对当前的时间减去一周)
    <select id="getCountByTimeRange" resultType="com.example.springboot.mapper.po.BorrowReturCountPO">
        select count(id) as count, DATE_FORMAT(createtime,'%Y-%m-%d') as date from
        <if test="type == 1">
            borrow
        </if>
        <if test="type == 2">
            retur
        </if>
        where
        <choose>
            <when test="timeRange == 'week'">
                createtime >=  DATE_SUB(NOW(),INTERVAL 1 WEEK)
            </when>
            <when test="timeRange == 'month'">
                createtime >=  DATE_SUB(NOW(),INTERVAL 1 MONTH)
            </when>
            <when test="timeRange == 'month2'">
                createtime >=  DATE_SUB(NOW(),INTERVAL 2 MONTH)
            </when>
            <when test="timeRange == 'month3'">
                createtime >=  DATE_SUB(NOW(),INTERVAL 3 MONTH)
            </when>
            <otherwise>
                createtime > now()
            </otherwise>
        </choose>
        group by date
    </select>