1.npm引入
npm install echarts -S
2.在组件中使用
//在组件中先通过import引入插件
import echarts from 'echarts'
3.完整代码,直接拷贝在组件中就能直接使用
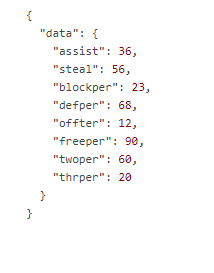
在这里我使用了 Easy mock模拟数据,如果感兴趣可自行百度,非常简单
(下面这张截图就是模拟数据)
<template>
    <div>
         <div class="echarts">
            <div id="myChart" :style="{width:'100%',height:'150px'}"></div>
        </div>
    </div>
</template>
<script>
import echarts from 'echarts'
export default {
    data(){
        return{
            tbabData : {}
        }
    },
    created(){
        this.getData();
    },
    mounted(){
        this.setMychart();
    },
    methods:{
    	//这个方法的作用是将图表宽高写死,解决图表只有100px的问题
        setMychart(){
            function getStyle(obj,attr){
                if(obj.currentStyle){
                    return obj.currentStyle[attr];
                }
                else{
                    return document.defaultView.getComputedStyle(obj,null)[attr];
                }
            }
            //获取父元素
            var echarts = document.querySelector('.echarts');
            //获取父元素宽高
            var echartsWidth = getStyle(echarts,'width');
            var echartsHeight = getStyle(echarts,'height');

            //获取图表元素
            var myChart = document.querySelector('#myChart');

            //将父元素宽高赋值给图表
            myChart.style.width = echartsWidth;
            myChart.style.height = echartsHeight;
        },
        //获取数据
        getData(){
            this.axios.get('https://easy-mock.com/mock/5c10e14fbe3cc90fa1b1706a/boke/api/leidatu')
            .then((response) => {
                this.tbabData = response.data.data;
                this.leidatu();
            })
            .catch((error) => {
                console.log(error);
            });
        },
        leidatu(){
            /*ECharts雷达图表*/
            var myChart = echarts.init(document.getElementById('myChart'));
            myChart.setOption({
            polar : [
                {
                    //定义图表对应文字从左到右的顺序
                    indicator : [
                        {text : '助攻', max  : 100},
                        {text : '抢断', max  : 100},
                        {text : '盖帽', max  : 100},
                        {text : '后板', max  : 100},
                        {text : '前板', max  : 100},
                        {text : '罚球', max  : 100},
                        {text : '二分', max  : 100},
                        {text : '三分', max  : 100},
                    ],
                    splitArea : {
                        show : true,
                        areaStyle : {
                            color: ['#fff']
                            // 图表背景网格的颜色
                        }
                },
                splitLine : {
                    show : true,
                    lineStyle : {
                        width : 1,
                        color : ['#ccc','#fff','#fff','#fff','#fff']
                        // 图表背景网格线的颜色
                        }
                    },
                    radius : 41
                }
            ],
            color:['#f60'],
            series : [
                {
                    type: 'radar',
                    center:['50%','50%'],  //图表相对容器居中
                    itemStyle: {
                        normal: {
                            areaStyle: {
                                type: 'default'
                            }
                        }
                    },
                    data : [
                        {
                            //value就是展示数据
                            value : [
                                this.tbabData.assist, //助攻
                                this.tbabData.steal, //抢断
                                this.tbabData.blockper, //盖帽
                                this.tbabData.defper, //后板
                                this.tbabData.offter, //前板
                                this.tbabData.freeper, //罚球
                                this.tbabData.twoper, //二分
                                this.tbabData.thrper //三分
                            ]
                        }
                    ]
                }
            ]
            })
        }
    }
}
</script>
<style>
    .echarts{
        width:300px;
        height:150px;
    }
</style>
4.效果图

5.遇到的问题
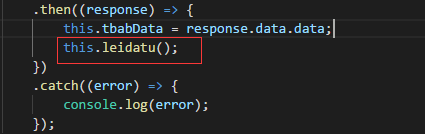
1.如果数据是从服务端获取的,this.leidatu()方法需要在.then处执行,否则或出现页面初始加载,雷达图数据为空的问题
2.如果是data里面定义的数据,**this.leidatu()可以直接在mounted(){}**钩子函数里执行