1、参数
matplotlib.pyplot.boxplot(x, notch=None, sym=None, vert=None, whis=None, positions=None, widths=None, patch_artist=None, bootstrap=None, usermedians=None, conf_intervals=None, meanline=None, showmeans=None, showcaps=None, showbox=None, showfliers=None, boxprops=None, labels=None, flierprops=None, medianprops=None, meanprops=None, capprops=None, whiskerprops=None, manage_ticks=True, autorange=False, zorder=None, capwidths=None, *, data=None)
x Array or a sequence of vectors.
输入的数据. If a 2D array, a boxplot is drawn for each column in x. If a sequence of 1D arrays, a boxplot is drawn for each array in x.
notch:布尔类型, 默认: False
绘制凹槽方框图(True)还是矩形方框图(False). 缺口代表中位数周围的置信区间(CI) 。 bootstrap字段的介绍中描述了如何计算凹槽的位置,但也可以通过设置 conf_intervals 参数来重写凹槽的位置。
sym:字符串类型, 可选操作
The default symbol for flier points. An empty string (‘’) hides the fliers. If None, then the fliers default to ‘b+’. More control is provided by the flierprops parameter.
vert :布尔类型, default: True
如果为 True,则绘制垂直方框(vertical boxes)。如果为 False,则绘制水平方框(horizontal boxes)。
whis:浮点数 或一堆浮点数形如: (float, float), 默认: 1.5
影线的位置.
如果为浮点数,则下影线位于 Q1 - whis*(Q3-Q1)以上的最低基准点,上影线位于 Q3 + whis*(Q3-Q1)以下的最高基准点,其中 Q1 和 Q3 分别为第一和第三四分位数。默认值 whis = 1.5 与 Tukey 最初对箱形图的定义一致。
如果是一对浮点,则表示绘制影线的百分位数(如 (5, 95))。特别是,将其设置为(0, 100)后,须线将覆盖整个数据范围。
在 Q1 == Q3 的边缘情况下,如果 autorange 为 True,影线会自动设置为(0,100)(覆盖整个数据范围)。
超出影线的数据将被视为异常值,并绘制为单个点。
bootstrap:整数, optional
Specifies whether to bootstrap the confidence intervals around the median for notched boxplots. If bootstrap is None, no bootstrapping is performed, and notches are calculated using a Gaussian-based asymptotic approximation (see McGill, R., Tukey, J.W., and Larsen, W.A., 1978, and Kendall and Stuart, 1967). Otherwise, bootstrap specifies the number of times to bootstrap the median to determine its 95% confidence intervals. Values between 1000 and 10000 are recommended.
usermedians:1D array-like, optional
A 1D array-like of length len(x). Each entry that is not None forces the value of the median for the corresponding dataset. For entries that are None, the medians are computed by Matplotlib as normal.
conf_intervals:array-like, optional
A 2D array-like of shape (len(x), 2). Each entry that is not None forces the location of the corresponding notch (which is only drawn if notch is True). For entries that are None, the notches are computed by the method specified by the other parameters (e.g., bootstrap).
positions:array-like, optional
箱体的位置。刻度和限值会自动设置为与位置相匹配。默认为 range(1,N+1),其中 N 是要绘制的方框数。
widths:浮点数或数组
箱体的宽度. 默认为 0.5,或 0.15乘以(极值位置之间的距离)(如果该值小于0.5的话)。
patch_artistbool, 默认为: False
如果为 False,则使用Line2D artist绘制方框。否则,将使用Patch artists 绘制方框。
labelssequence, optional
Labels for each dataset (one per dataset).
manage_ticksbool, default: True
If True, the tick locations and labels will be adjusted to match the boxplot positions.
autorangebool, default: False
When True and the data are distributed such that the 25th and 75th percentiles are equal, whis is set to (0, 100) such that the whisker ends are at the minimum and maximum of the data.
meanlinebool, default: False
If True (and showmeans is True), will try to render the mean as a line spanning the full width of the box according to meanprops (see below). Not recommended if shownotches is also True. Otherwise, means will be shown as points.
zorderfloat, 默认: Line2D.zorder = 2
箱体图的阶数
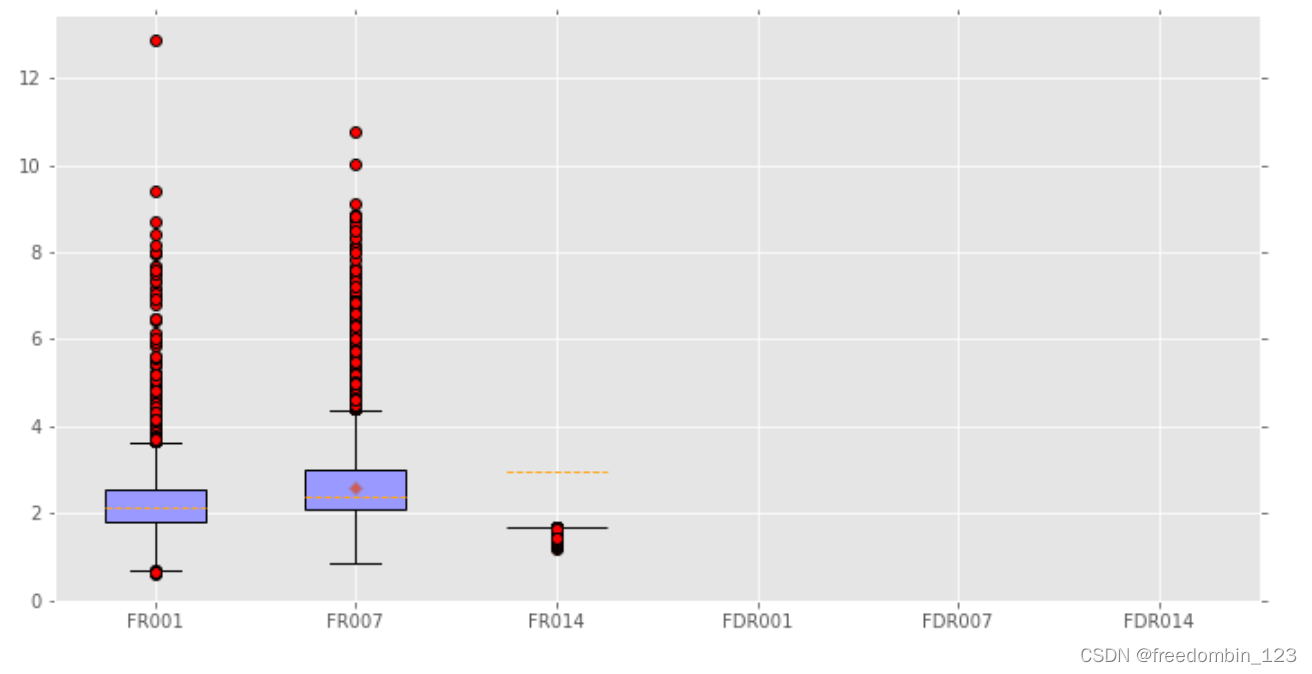
2、样例
# 数据下载自 中国货币网
df = pd.read_excel("../data/回购定盘利率.xlsx")
df = df.iloc[7:-2]
# 设置图形的显示风格
fig = plt.figure(figsize=(12, 6))
plt.style.use('ggplot')

# 设置中文和负号正常显示
plt.rcParams['font.sans-serif'] = 'sans-serif'
plt.rcParams['axes.unicode_minus'] = False


# 设置y轴的范围
# plt.ylim(0,85)
list_arr = [df["FR001"].values,df["FR007"].values,
            df["FR014"].values,df["FDR001"].values,
           df["FDR007"].values,df["FDR014"].values]
# 绘图
plt.boxplot(x = list_arr,
            patch_artist=True,
            # 添加具体的标签名称
            labels = ['FR001','FR007','FR014',"FDR001","FDR007","FDR014"],
            showmeans=True,
            boxprops = {

    'color':'black','facecolor':'#9999ff'},
            flierprops = {

    'marker':'o','markerfacecolor':'red','color':'black'},
            meanprops = {

    'marker':'D','markerfacecolor':'indianred'},
            medianprops = {

    'linestyle':'--','color':'orange'})
# 去除箱线图的上边框与右边框的刻度标签
plt.tick_params(top='off', right='off')

# 显示图形
plt.show()
3、参考
matplotlib官网