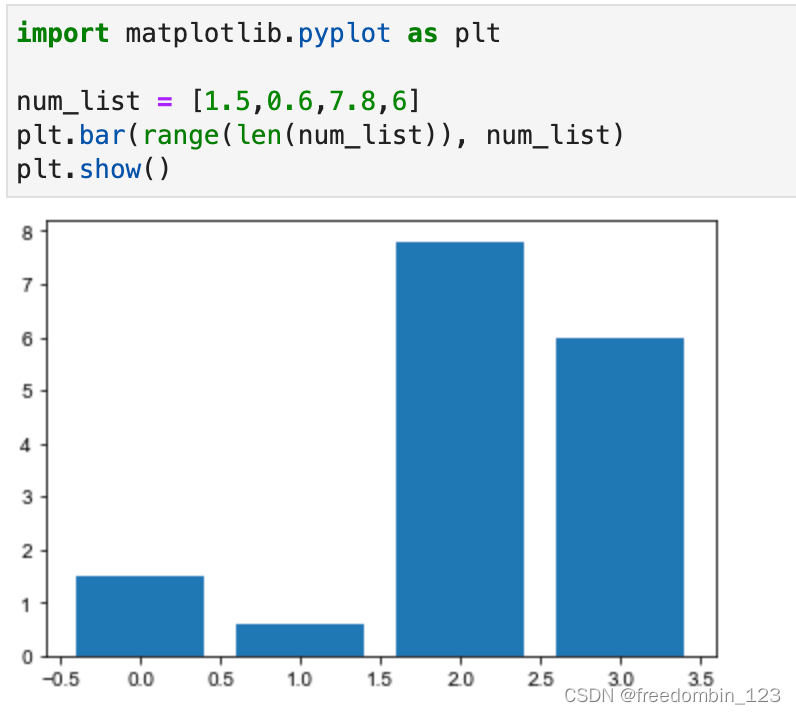
1、常用柱状图
# -*- coding: utf-8 -*-
import matplotlib.pyplot as plt

num_list = [1.5,0.6,7.8,6]
plt.bar(range(len(num_list)), num_list)
plt.show()
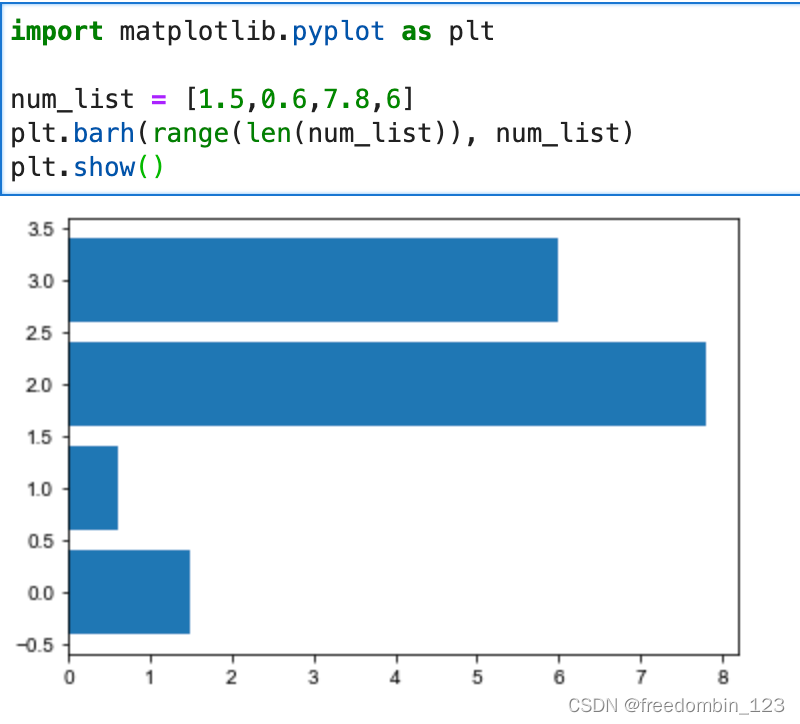
横向柱状图
# -*- coding: utf-8 -*-
import matplotlib.pyplot as plt

num_list = [1.5,0.6,7.8,6]
plt.barh(range(len(num_list)), num_list)
plt.show()
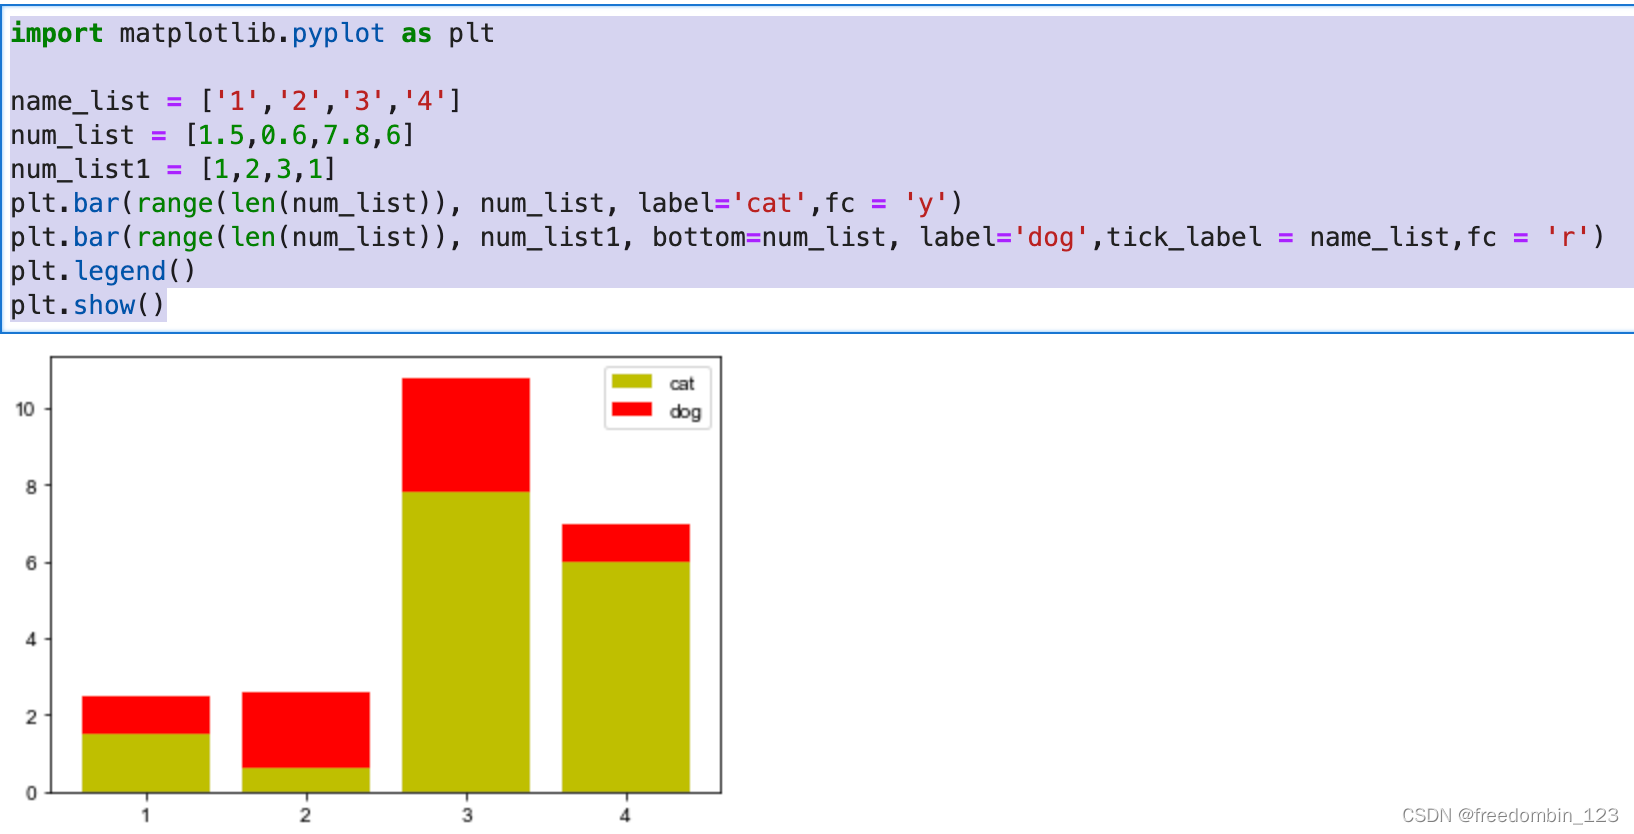
2、堆叠柱状图
# -*- coding: utf-8 -*-
import matplotlib.pyplot as plt

name_list = ['1','2','3','4']
num_list = [1.5,0.6,7.8,6]
num_list1 = [1,2,3,1]
plt.bar(range(len(num_list)), num_list, label='cat',fc = 'y')
plt.bar(range(len(num_list)), num_list1, bottom=num_list, label='dog',tick_label = name_list,fc = 'r')
plt.legend()
plt.show()
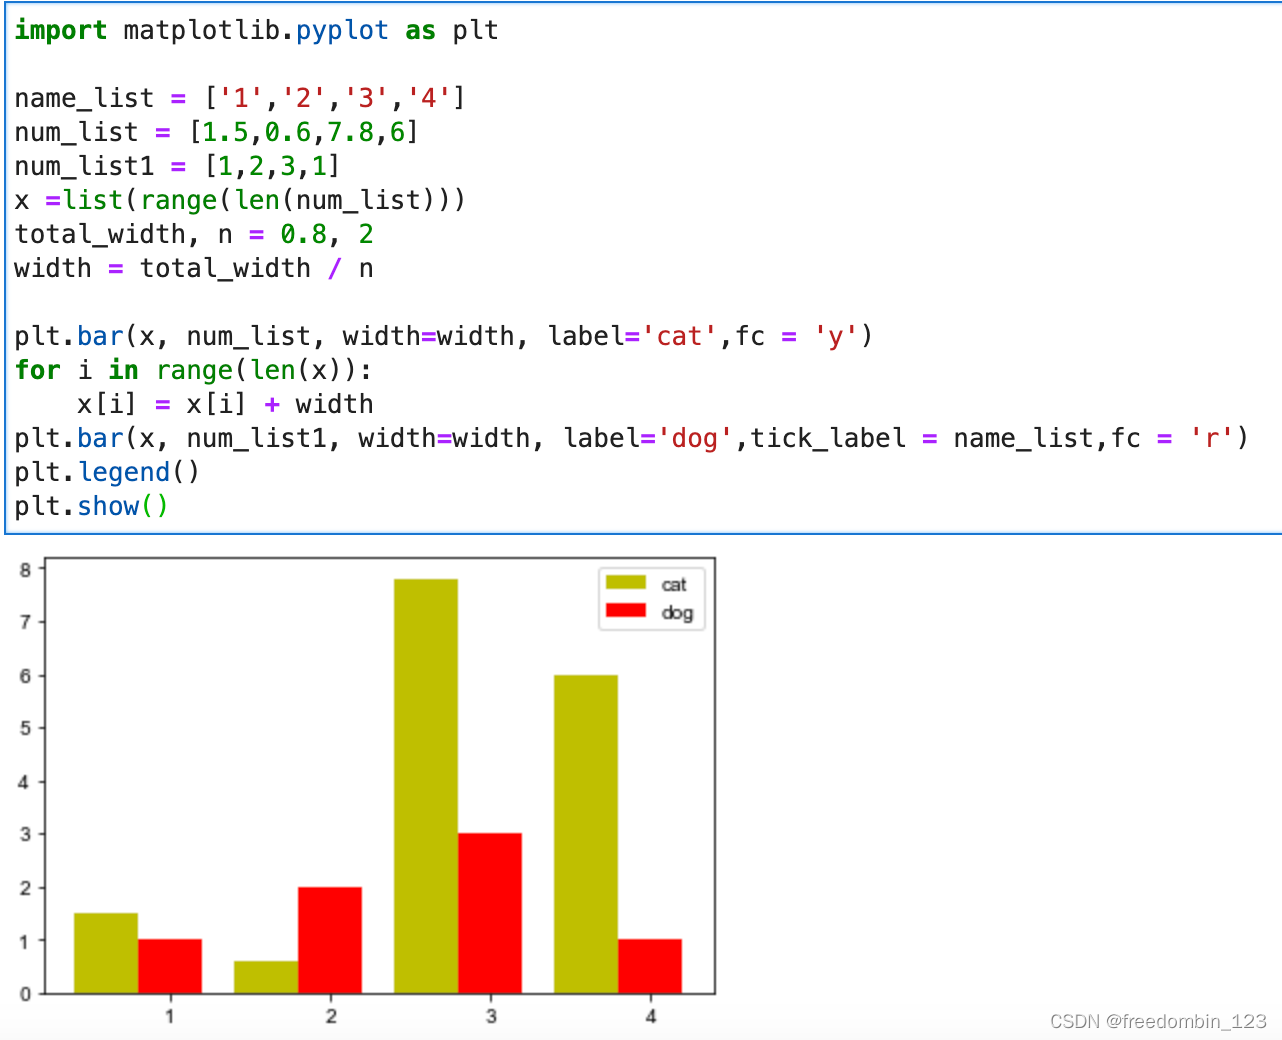
3、并列柱状图
# -*- coding: utf-8 -*-
import matplotlib.pyplot as plt

name_list = ['1','2','3','4']
num_list = [1.5,0.6,7.8,6]
num_list1 = [1,2,3,1]
x =list(range(len(num_list)))
total_width, n = 0.8, 2
width = total_width / n

plt.bar(x, num_list, width=width, label='cat',fc = 'y')
for i in range(len(x)):
    x[i] = x[i] + width
plt.bar(x, num_list1, width=width, label='dog',tick_label = name_list,fc = 'r')
plt.legend()
plt.show()