目录
导包
from sklearn.datasets import load_iris
from sklearn.tree import plot_tree
from sklearn import tree
from sklearn.tree import DecisionTreeClassifier
import matplotlib.pyplot as plt
import pandas as pd
import numpy as np
决策树可视化方法
1、不需要安装graphviz软件包
鉴于实际建模应用往往是xgb、lgb等,决策树更多用于分析,所以此处将决策树建模与可视化封装在一起,方便实用
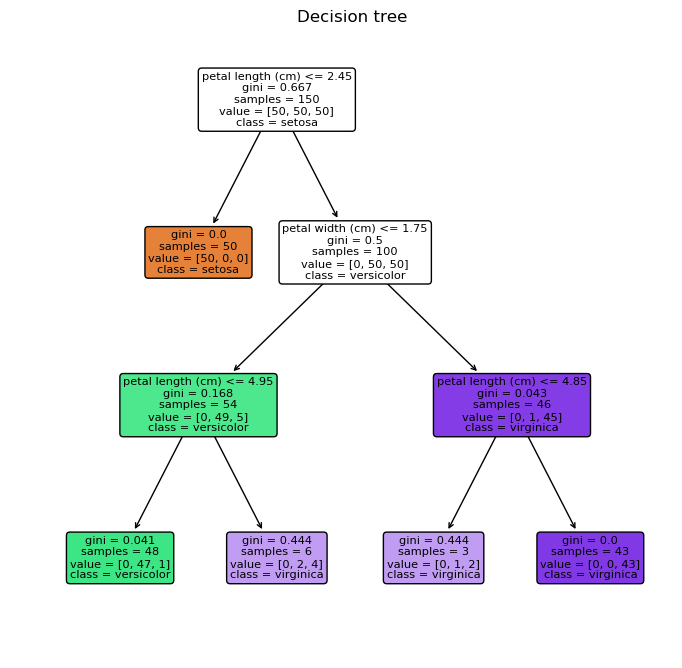
def DecisionTree_plot(x,y,feature_names=None,target_names=None,max_depth=3,min_samples_leaf=10):
    clf = DecisionTreeClassifier(max_depth=max_depth,min_samples_leaf=min_samples_leaf).fit(x,y)
    plt.figure(dpi=100,figsize=(8,8))
    plot_tree(clf, filled=True,rounded=True,feature_names=feature_names,
                         class_names=target_names)
    plt.show()
iris = load_iris()
DecisionTree_plot(iris.data,iris.target,iris.feature_names,iris.target_names)
可以看到,使用原生方法可视化的结果还是比较简陋的
2、 决策树可视化方法2,需要安装graphviz软件包
import graphviz
def DecisionTree_plot2(x,y,feature_names=None,target_names=None,max_depth=3,min_samples_leaf=10):
    clf = DecisionTreeClassifier(max_depth=max_depth,min_samples_leaf=min_samples_leaf).fit(x,y)
    dot_data = tree.export_graphviz(clf,
                         feature_names=iris.feature_names,
                         class_names=iris.target_names,
                         filled=True, rounded=True,
                         special_characters=True)
    graph = graphviz.Source(dot_data)
    return graph
DecisionTree_plot2(iris.data,iris.target,iris.feature_names,iris.target_names)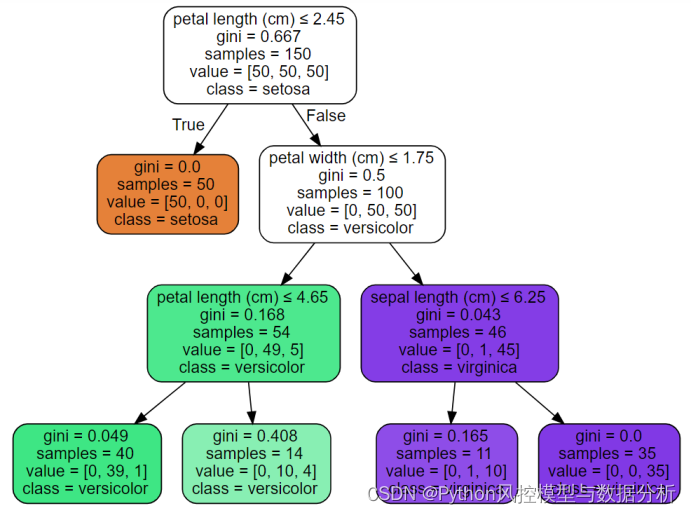
xgb、lgb建模
import xgboost as xgb
import pandas as pd
import numpy as np

df=pd.read_excel('data.xlsx')
xgb_df = xgb.DMatrix(df.drop('y',axis=1), label =df.y)
lgb_df =lgb.Dataset(df.drop('y',axis=1), label =df.y)

param = {'max_depth':3, 'eta':0.2, 'min_child_weight':50}
xgb_model = xgb.train(param, dtrain)
lgb_model = lgb.train(param, dtrain)
xgb可视化
其中num_trees为子树的索引
xgb.to_graphviz(xgb_model, num_trees=0, rankdir='UT')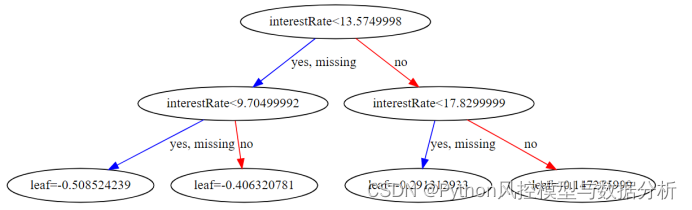
lgb可视化
lgb.create_tree_digraph(model, tree_index=0,encoding='UTF-8')
关注公众号Python风控模型与数据分析,更多知识、代码分享
往期精彩文章