Urban3D数据集内容简介
Urban3D数据集图像为正摄RGB影像,分辨率为50cm。
从SpaceNet上使用aws下载数据,文件夹结构为:
|- 01-Provisional_Train
	|- GT
		|- GT中包含GTC,GTI,GTL.tif文件,GTL为ground truth building footprint。
	|- Inputs
		|- Inputs中包含DSM,DTM,RGB.tif文件,DSM为Digital Surface Models,DTM为Digital Terrain Models,normalized DSM (nDSM = DSM - DTM)
|- 02-Provisional_Test
|- 03-Sequestered_Test
|- 04-Unused_Data
|- AOI_polygons
|- Pretrained_Models
   |- 包含前6名参赛团队的模型
每一块.tif大小为2048*2048。
Urban3D数据集读取
from torchvision import transforms
import numpy as np
from PIL import Image
import matplotlib.pyplot as plt
import sys
rgb = Image.open("/01-Provisional_Train/Inputs/JAX_Tile_016_RGB.tif")
dsm = Image.open("/01-Provisional_Train/Inputs/JAX_Tile_016_DSM.tif")
gtl = Image.open("/01-Provisional_Train/GT/JAX_Tile_016_GTL.tif")
print(rgb.size, dsm.size, gtl.size) >> (2048, 2048) (2048, 2048) (2048, 2048)
print(np.array(rgb).shape, np.array(dsm).shape, np.array(gtl).shape) >> (2048, 2048, 3) (2048, 2048) (2048, 2048)
print(np.array(rgb).dtype, np.array(dsm).dtype, np.array(gtl).dtype) >> uint8 float32 uint8
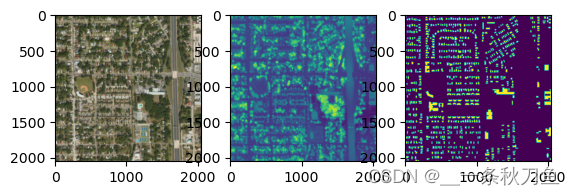
fig = plt.figure()
plt.subplot(131)
plt.imshow(np.array(rgb))
plt.subplot(132)
plt.imshow(np.array(dsm))
plt.subplot(133)
plt.imshow(np.array(gtl))
print(np.max(gtl), np.min(gtl)) >> 6, 2
Urban3D数据集Pytorch处理
使用深度学习需要对Urban3D数据进行裁剪,这里采用torchvision.transforms.RandomCrop进行裁剪。RandomCrop可以直接作用于PIL.Image打开的文件和torch类型的数据上,但不能作用于numpy数组。具体内容可以参考numpy, PIL, tensor类型在torchvision.transforms时使用
def type_convert(x):
    x_ = np.array(x).astype(np.float32)
    return x_
def to_tensor(x):
    x_ = np.expand_dims(x, axis=0)
    x_ = torch.from_numpy(x_)
    return x_
trans = transforms.Compose([
    transforms.RandomCrop(size=256),
    transforms.Lambda(type_convert),
    transforms.Lambda(to_tensor)
])

torch.random.manual_seed(16)
rgb_crop = trans(rgb)
torch.random.manual_seed(16)
dsm_crop = trans(dsm)
torch.random.manual_seed(16)
gtl_crop = trans(gtl)
print(rgb_crop.size(), dsm_crop.size(), gtl_crop.size())
fig = plt.figure()
plt.subplot(131)
plt.imshow(rgb_crop[0,:,:,0])
plt.subplot(132)
plt.imshow(dsm_crop[0,:,:])
plt.subplot(133)
plt.imshow(gtl_crop[0,:,:])
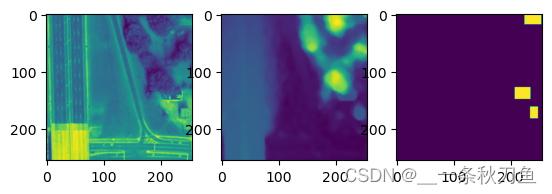
同时还需要注意的一点是为了保证RandomCrop后data和label的一致性,需要设置随机数种子。对于GTL需要改变label的值。
def type_convert_gtl(x):
    x_ = np.array(x).astype(np.float32)
    x_[x_==6]=1
    x_[x_==2]=0
    return x_