[Python库] matplotlib
matplotlib库中最常用的是pyplot。要想显示自己想要的图,首先要进行图像配置,接着进行图像显示。
图像配置:
plt.plot(……)
plt.……
图像显示(后面每次显示图像都要调用,本博客中省略了,自行跑的时候需要加上plt.show()):
plt.show()
输入:可以是numpy中的ndarray,也可以是list,也可以是Dataframe。
xpoints = np.array([0, 1, 2, 6, 14, 55, 123, 545])
ypoints = np.array([0, 6, 100, 250, 232, 565, 32, 45])
y1 = np.array([1, 544, 12, 43, 24, 345, 343, 657])
y2 = np.array([56, 325, 3, 78, 34, 2, 5234, 42])
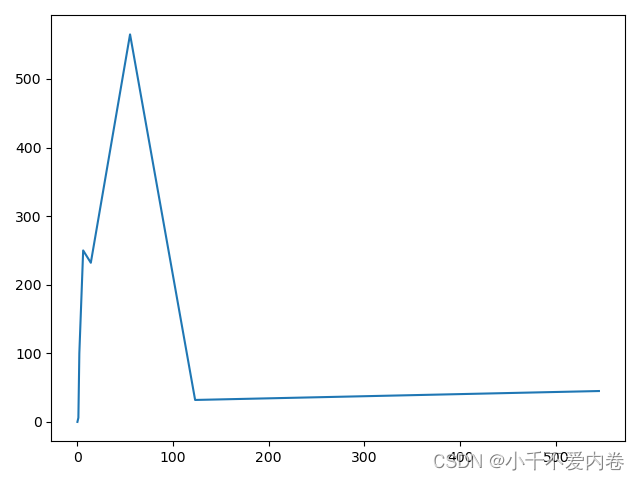
默认绘制一条从点到点的直线:
plt.plot(xpoints, ypoints)
无线绘图:
plt.plot(xpoints, ypoints, 'o')

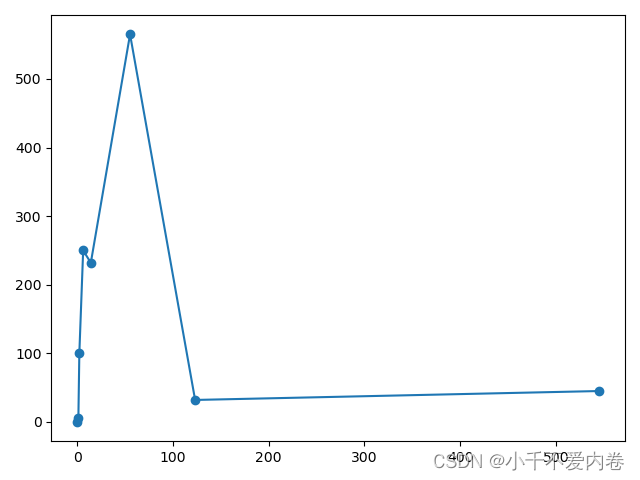
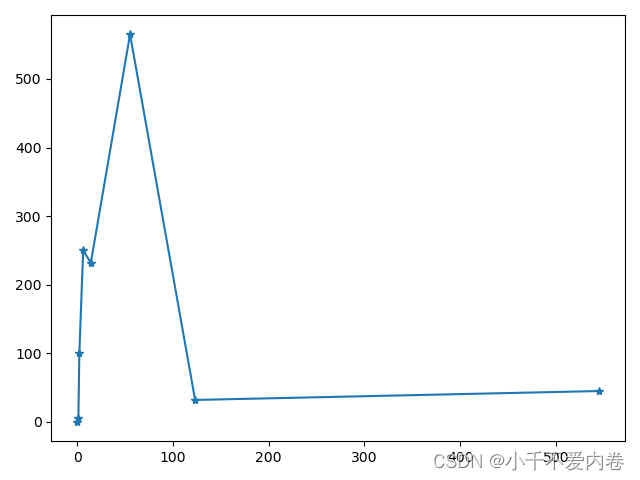
marker标记:
plt.plot(xpoints, ypoints, marker='o')
plt.plot(xpoints, ypoints, marker='*')
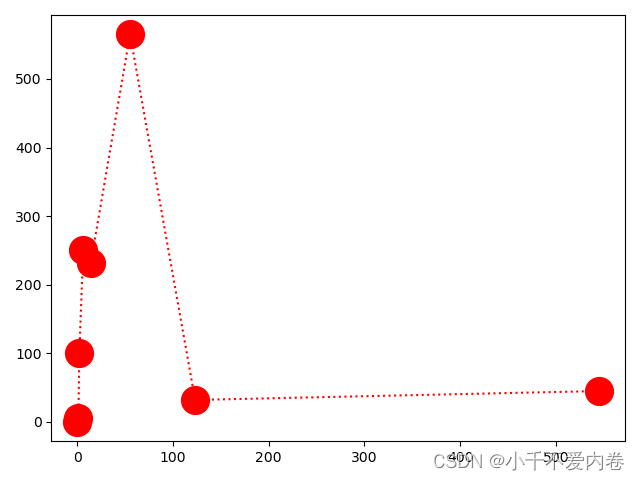
圆形标记|虚线|红色,点的大小=20:
plt.plot(xpoints, ypoints, 'o:r', ms=20)
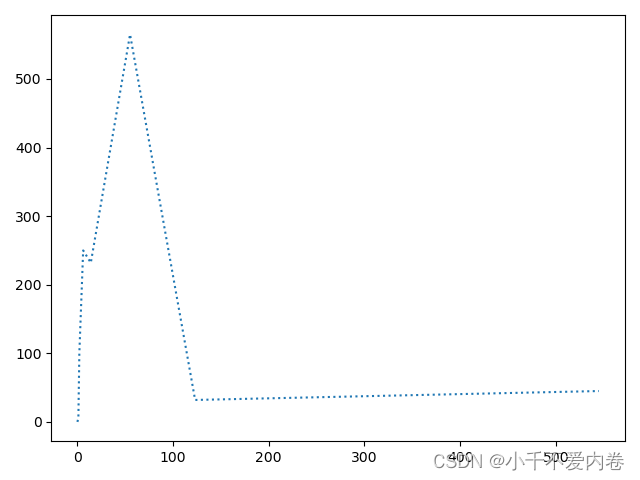
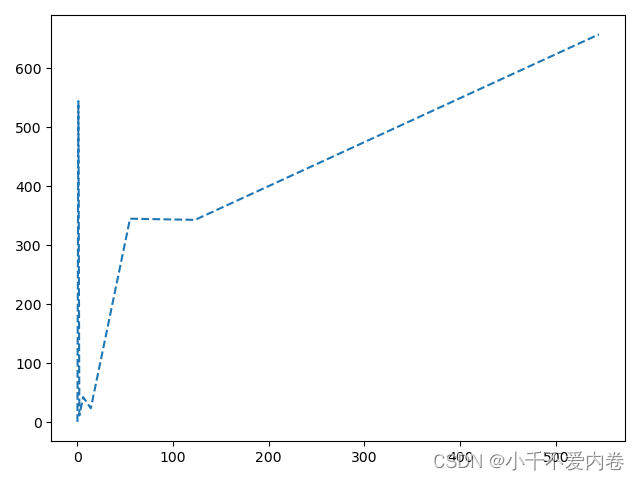
线条,一半使用linestyle或者ls来表示,linewidth用lw表示:
plt.plot(xpoints, ypoints, linestyle='dotted')
plt.plot(xpoints, y1, ls='--')
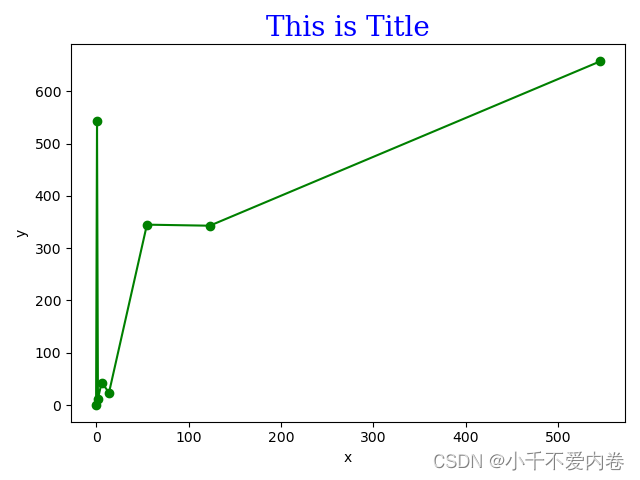
为绘图创建标签、标题:
# 字体
font1 = {

    'family':'serif', 'color':'blue', 'size':20}
plt.title("This is Title", fontdict=font1)
plt.xlabel('x')
plt.ylabel('y')
plt.plot(xpoints, y1, 'o-g')
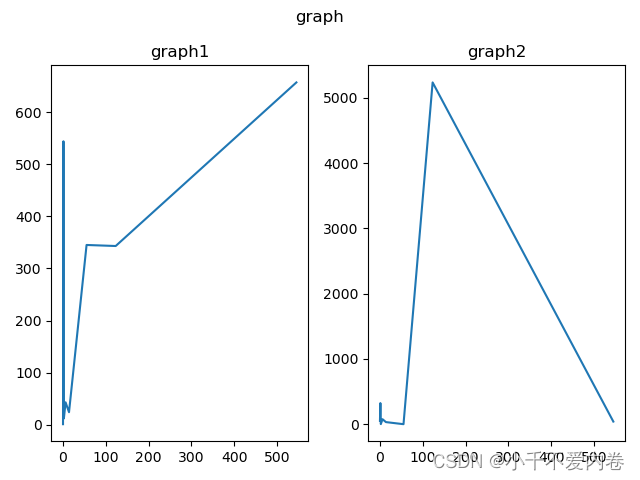
显示多个图:
# 表示一行两列的第一张子图
plt.subplot(1, 2, 1)
plt.plot(xpoints, y1)
plt.title("graph1")
# 表示一行两列的第二张子图
plt.subplot(1, 2, 2)
plt.plot(xpoints, y2)
plt.title("graph2")
# 超级标题
plt.suptitle("graph")
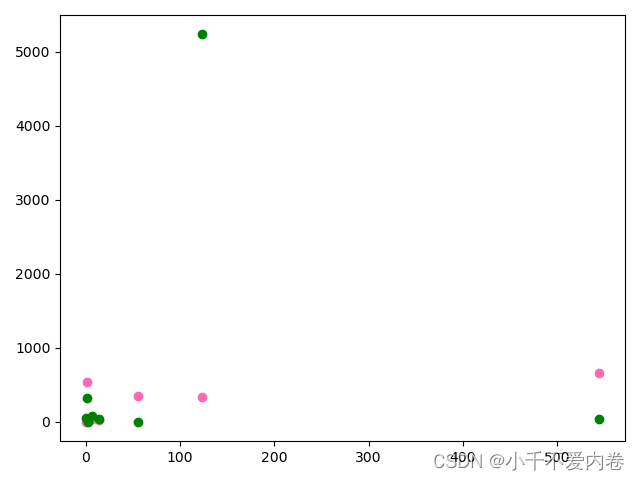
散点图:
plt.scatter(xpoints, y1, color='hotpink')
plt.scatter(xpoints, y2, color="green")
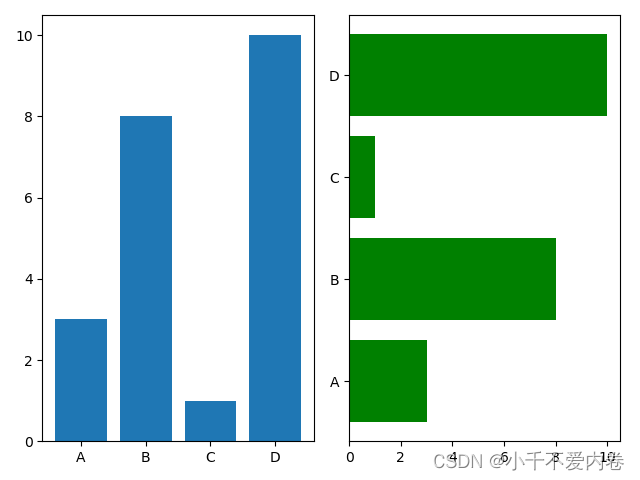
柱状图:
x = np.array(["A", "B", "C", "D"])
y = np.array([3, 8, 1, 10])
plt.subplot(1, 2, 1)
# 柱状图
plt.bar(x, y)
plt.subplot(1, 2, 2)
# 水平柱状图
plt.barh(x, y, color='green')
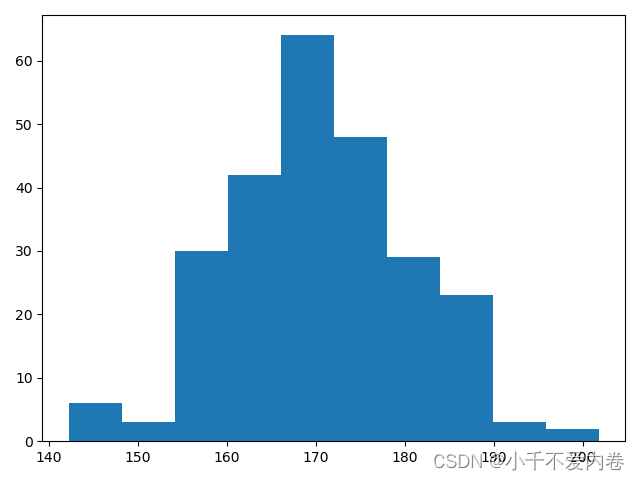
直方图:
x = np.random.normal(170, 10, 250)
print(x)
plt.hist(x)