目录
R手册(Visualise)–ggplot2 (Part 1)
R手册(Visualise)–ggplot2 (Part 2)
ggplot2
ggplot2基于the grammar of graphics思想,通过数据集、几何对象和坐标系统建立图形。
所有的ggplot2绘图都以ggplot()开始, 默认由aes()将数据集映射至几何对象。在行尾+添加图层:几何,比例尺,坐标和面等。要将绘图保存,请使用ggsave().
Scales
Scales传递数据给几何对象,改变图形的默认标尺。
p <- ggplot(mpg, aes(fl)) +
  geom_bar(aes(fill = fl))

p + scale_fill_manual(
# scale: scale, fill: 几何对象, manual: 预处理的scale类型
  values = c("skyblue", "royalblue", "blue","navy"), #scale参数
  limits = c("d", "e", "p", "r"), #限制范围
  breaks =c("d", "e", "p", "r"), #breaks to use in legend/axis
  labels = c("D", "E", "P", "R"), #labels to use in legend/axis
  name = "fuel") #legend/axis 标题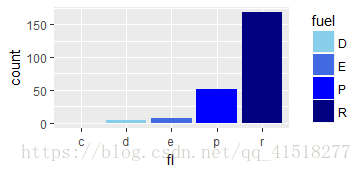
1. 常用标尺格式
(color,size,fill,shape,linetype,alpha,etc)
scale_<type>_continuous()连续变量映射
scale_<type>_discrete() 离散变量映射
scale_<type>_identity() 原始数据直接映射
scale_<type>_manual(value=c(…))自定义值范围
2. 坐标轴标尺
| X & Y location scales | 说明 |
|---|---|
| lims(x,y)/xlim()/ylim() | |
| scale_x_continuous(breaks, labels,limits) | 刻度,标签,值的范围 |
| scale_x_discrete(breaks, labels,limits) | |
| scale_x_date(date_breaks , date_labels) | 日期间隔(”2 weeks”),日期显示格式(”%m/%d”) |
| scale_x_datetime() | 时间日期,参数同date |
| scale_x_log10() | log10 标尺 |
| scale_x_reverse() | x轴方向颠倒 |
| scale_x_sqrt() |
2. Color and fill scales
| Continuous | 说明 |
|---|---|
| scale_fill_distiller(palette = “Blues”) | |
| scale_fill_gradient(low,high) | 渐变色调控 |
| scale_fill_gradient2(low,mid,high,midpoint) | 2极渐变色 |
| scale_fill_gradientn(values) | n极渐变色 |
| Discrete | |
| scale_fill_hue() | 离散色阶 |
| scale_fill_brewer(palette = “Blues”) | 调色板 |
| scale_fill_grey(start, end) | 灰色调 |
调色板离散色阶palette选择:
RColorBrewer::display.brewer.all()
连续色阶选择:
Also: rainbow(), heat.colors(), terrain.colors(), cm.colors()
RColorBrewer::brewer.pal()
#离散色阶
p <- ggplot(mpg, aes(fl)) +
geom_bar(aes(fill = fl))
p +scale_fill_brewer(palette = "Blues")+
ggtitle('scale_fill_brewer')
p + scale_fill_grey(start = 0.2, end = 0.8,na.value = "red") +
ggtitle('scale_fill_grey')
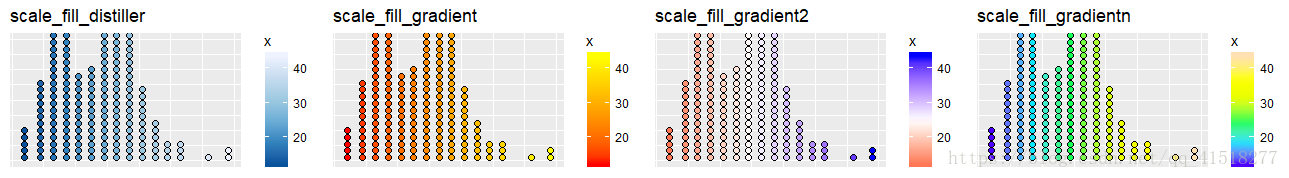
#连续色阶
p <- ggplot(mpg, aes(hwy))+
geom_dotplot(aes(fill = ..x..))
p + scale_fill_distiller(palette = "Blues") +
ggtitle('scale_fill_distiller')
p + scale_fill_gradient(low="red", high="yellow") +
ggtitle('scale_fill_gradient')
p + scale_fill_gradient2(low="red", high="blue", mid = "white", midpoint = 25) +
ggtitle('scale_fill_gradient2')
p +scale_fill_gradientn(colours=topo.colors(6)) +
ggtitle('scale_fill_gradientn')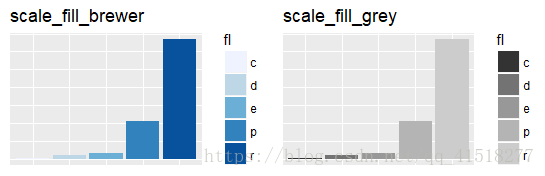
Shape and size scales
| shape | 说明 |
|---|---|
| scale_shape() | 形状 |
| scale_shape_manual(values) | |
| size | |
| scale_size() | 大小 |
| scale_radius(range) | 半径 |
shape:

df <- data.frame(x=1:10,y=sample(1:10,10),
                 s1=rnorm(10),
                 s2=sample(1:4,10,replace = TRUE))
p <- ggplot(df, aes(x, y))+
  geom_point(aes(shape = factor(s2), size = s1, color=factor(s2)))
p + scale_shape_manual(values = c(3:7))
p + scale_radius(range = c(1,6))
Coordinate Systems
| Coordinate Systems | 参数 | 说明 |
|---|---|---|
| coord_cartesian() | xlim,ylim | 笛卡尔坐标(默认) |
| coord_fixed() | radio,xlim,ylim | 具有固定纵横比的直角坐标 |
| coord_flip | xlim,ylim | x和y翻转(笛卡尔坐标) |
| coord_polar | theta, start, direction | 极坐标 |
| coord_trans() | xtrans, ytrans,xlim,ylim | 变换笛卡尔坐标系,xtrans, ytrans接收函数名 |
| coord_quickmap() coord_map(projection = “ortho”,orientation ) |
projection, orienztation, xlim, ylim | 地图投影 projections:{mercator (default), azequalarea, lagrange, etc.} |
ggplot(mpg, aes(fl)) + them_blank+
geom_bar()+
coord_polar(theta = "x", direction=1)
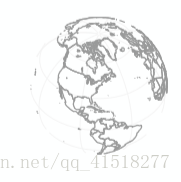
world <- map_data("world")
worldmap <- ggplot(world, aes(x = long, y = lat, group = group)) +
geom_path() +
scale_y_continuous(breaks = (-2:2) * 30) +
scale_x_continuous(breaks = (-4:4) * 45)
worldmap + coord_map("ortho", orientation = c(41, -74, 0))
Position Adjustments
Position adjustments 对geoms进行位置调整。
geom参数赋值字符串
字符串: identity,jitterdodge (同时闪避和抖动),nudge(微距点固定距离)
| geom | position |
|---|---|
| geom_bar/aera/density | dodge(并排), stack/fill(堆叠) |
| geom_point | jitter(减少点重叠) |
| geom_label | nudge(轻推来自点的标签) |
geom参数赋值position函数
| position函数 | 说明 |
|---|---|
| position_dodge(width) | 抖动宽度(geom默认width=0.9,调用此函数时,width应设为0.9) |
| position_identity() | 不调整 |
| position_jitter(width , height ) | |
| position_jitterdodge() | |
| position_nudge(x = 0, y = 0) | 平移距离 |
| position_stack(vjust = 1) | 对齐方式 |
| position_fill(vjust = 1) |
p <- ggplot(mpg, aes(fl, fill = drv))

p +  geom_bar(position = "dodge")+
  ggtitle('position = "dodge"')
p +  geom_bar(position = "fill")+
  ggtitle('position = "fill"')
p +   geom_bar(position = "stack")+
  ggtitle('position = "stack"')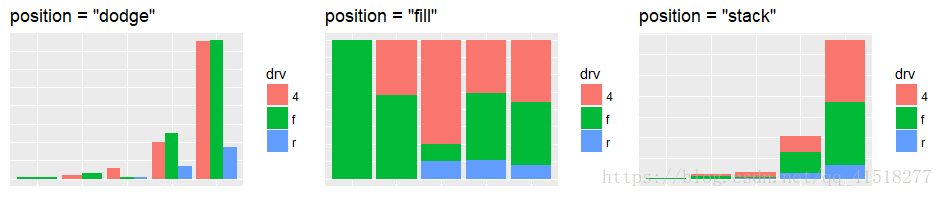
Themes
theme(…)
设置主题包括title,axis,legend, panel, background,etc
| 主题函数 | 说明 |
|---|---|
| theme_bw(base_size,base_family) | 黑白主题 |
| theme_grey() | 灰色主题(默认) |
| theme_dark() | 黑色主题 |
| theme_void() | 空主题 |
| theme_minimal() | 最小主题 |
| ggtech::theme_tech() | 技术主题 |
控制theme元素函数(作为主题组件的参数出现):
| 元素函数 | 说明 |
|---|---|
| element_blank | 清空 |
| element_rect(fill,color,size,linetype) | 边框和背景 |
| element_text(family,face, color, size,hjust, vjust,angle,lineheight, margin, debug) | 文字,参数:lineheight(行高), margin(边缘), debug(是否矩形背景) |
| element_line(color,size,linetype,lineend,arrow) | Line end style (round, butt, square),添加箭头: grid::arrow(angle,length,ends=”last”/”first”/”both”) |
Faceting
刻面通过类别变量将图形分块显示。
| 刻面函数 | 说明 |
|---|---|
| facet_grid(var.row~var.col,scales,labeller) | 网格图,单变量时var.row或var.col用点填充 |
| facet_wrap(~var+var,nrow,ncol,scales,labeller) | 将1d的面板卷成2d网格(nrow*ncol) |
| ggforce::facet_zoom(x, y, xy, split = FALSE, zoom.size = 2) | 子集zoom,x,y,xy 赋值(逻辑值):选取x轴,y轴,xy交叉子集 |
t <- ggplot(mpg, aes(cty, hwy)) + geom_point()
t + facet_grid(year ~ fl)

# ggforce::facet_zoom
ggplot(iris, aes(Petal.Length, Petal.Width, colour = Species)) +
    geom_point() +
    ggforce::facet_zoom(x = Species == "versicolor")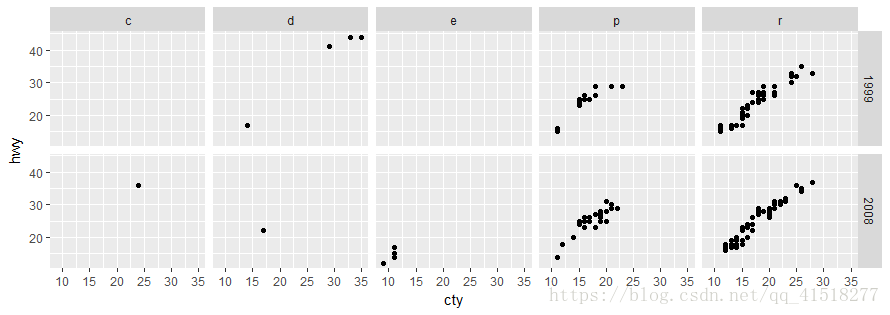
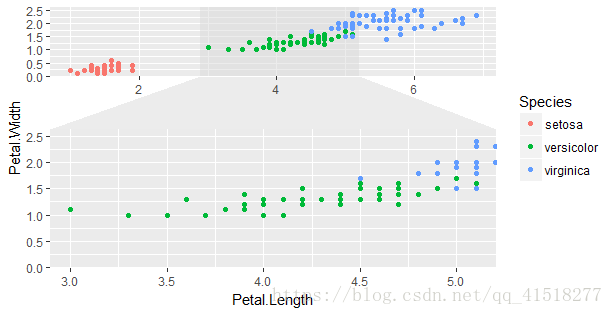
scales参数:坐标刻度自由
“fixed”(default,坐标尺度统一), “free”(坐标尺度自由),”free_x”,”free_y”
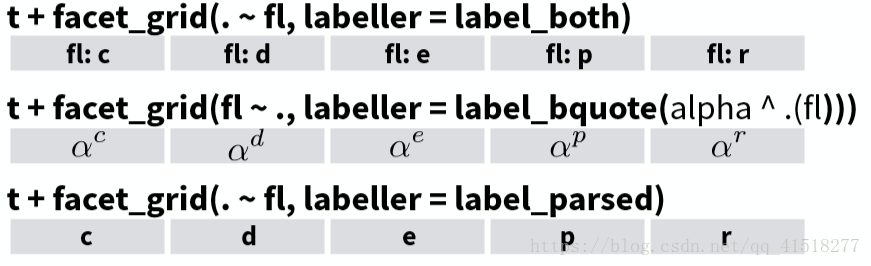
labeller参数: 调整刻面标签
Annotations and Labels
| Labels | 说明 |
|---|---|
| ggtitle(label, subtitle = NULL) | 图标题 |
| labs(x,y,title,subtitle,caption) | x/y轴标题 |
| xlab(label)/ylab(label) | x/y轴标题 |
| Annotations | 说明 |
|---|---|
| annotate(geom,…) | geom注释,其余参数为geom参数 |
| annotate(“text”,x,y,label, parse=FALSE) | 文本注释 |
| annotate(“pointrange”, x , y, ymin, ymax) | |
| annotate(“rect”, xmin, xmax, ymin, ymax) | 矩形注释 |
| annotate(“segment”,x, xend, y, yend, arrow) | 线段注释 |
文本注释参数parse:是否数学表达式, 更多公式语法可参考?plotmath
线段注释参数arrow: 添加箭头grid::arrow(angle,length,ends=”last” / ”first”/”both”)
Legends
theme(legend.position = "none"/"bottom"/"top"/"left"/"right") 在主题中设置 Legend
guides(…)设置legends几何组件:colorbar, legend, or none (no legend)
| guide函数 | 作为scale或guides()的参数设置 |
|---|---|
| guide_colorbar(title,label…) | 连续型变量 |
| guide_legend(title,label…) | 离散型变量 |
Vector helpers
| 函数 | 说明 |
|---|---|
| stats::recoder(x_char,x_num,order=FALSE) | 重排序,返回factor/ord.factor |
| cut_interval(x,n,length) | n组有相同宽度的观测值 |
| cut_number(x,n) | n组有相同数量的观测值 |
| cut_width(x,width,center,boundary, closed = c(“right”,”left”)) |
混合图
gridExtra包可以将多个ggplot2对象组合到一张图中
gridExtra::grid.arrange(plot1,plot2,…,nrow,ncol)