基于深度学习的运动目标检测(三)YOLOv3识别物体
目标检测,粗略地说就是输入图片/视频,经过处理后得到目标的位置信息(比如左上角和右下角的坐标)、目标的预测类别、目标的预测置信度。前面我们阐述了不少理论知识,现在需要动手实战了。对于初学者来说,自己实现YOLO算法不太现实,幸运的是OpenCV的DNN(Deep Neural Network)模块封装了Darknet框架(封装了YOLO算法)。使用OpenCV能更方便地直接运行已训练的深度学习模型,本次采用在目标检测中最强劲的YOLOv3,基本步骤是先让OpenCV加载预训练YOLOv3模型,然后进行各种检测,比如图片识别、打开计算机自带摄像头进行物体检测等。
为了加载预训练YOLOv3模型,需要准备3个文件(在工程目录下):yolov3.cfg、yolov3.weights和coco.names。其中,yolov3.cfg为yolov3网络配置文件,yolov3.weights为权重文件,coco.names为标签文件。
1.基于YOLOv3识别物体
使用OpenCV dnn模块加载YOLO模型,代码如下:
net = cv2.dnn.readNet("yolov3.weights", "yolov3.cfg")
从coco.names导入类别并存储为列表,代码如下:
classes = []
with open("coco.names","r")as f:
	classes = [line.strip() for line inf.readlines()]
print(classes)
完整代码:
import cv2
import numpy as np

net = cv2.dnn.readNet("yolov3.weights", "yolov3.cfg")
classes = []
with open("coco.names", "r") as f:   #这里使用的是coco所训练的模型yolov3.cfg所以这里对应为coco.names
    classes = [line.strip() for line in f.readlines()]

print(classes)

layer_names = net.getLayerNames()
print(layer_names)

output_layers = [layer_names[i[0] - 1] for i in net.getUnconnectedOutLayers()]
print(output_layers)

img = cv2.imread("demo1.jpg")

# 获取图像尺寸与通道值
height, width, channels = img.shape
print('The image height is:',height)
print('The image width is:',width)
print('The image channels is:',channels)

blob = cv2.dnn.blobFromImage(img, 1.0 / 255.0, (416, 416), (0, 0, 0), True, crop=False)


from matplotlib import pyplot as plt

fig = plt.gcf()
fig.set_size_inches(20, 10)

num = 0
for b in blob:
    for img_blob in b:
        img_blob=cv2.cvtColor(img_blob, cv2.COLOR_BGR2RGB)
        num += 1
        ax = plt.subplot(3/3, 3, num)
        ax.imshow(img_blob)
        title = 'blob_image:{}'.format(num)
        ax.set_title(title, fontsize=20)


net.setInput(blob)
outs = net.forward(output_layers)

for i in range(len(outs)):
    print('The {} layer out shape is:'.format(i), outs[i].shape)

class_ids = []
confidences = []
boxes = []

i = 0
for out in outs:
    for detection in out:
        a = sum(detection[5:])
        if a > 0:
            print(detection[5:])
            i += 1
        if i == 2:
            break


i = 0
for out in outs:
    for detection in out:
        print('中心像素坐标 X 对原图宽比值:',detection[0])
        print('中心像素坐标 Y 对原图高比值:',detection[1])
        print('边界框的宽度 W 对原图宽比值:',detection[2])
        print('边界框的高度 H 对原图高比值:',detection[3])
        print('此边界框置信度:',detection[4])
        break
    break


plt_img = cv2.cvtColor(img, cv2.COLOR_BGR2RGB)

fig = plt.gcf()
fig.set_size_inches(20, 10)

plt.imshow(plt_img)

# jupyter 对每次运行结果会保留,再次运行列表创建
class_ids = []
confidences = []
boxes = []

i = 0

for out in outs:
    for detection in out:
        scores = detection[5:]
        class_id = np.argmax(scores)
        confidence = scores[class_id]
        if confidence > 0.5:
            center_x = int(detection[0] * width)
            center_y = int(detection[1] * height)

            w = int(detection[2] * width)
            h = int(detection[3] * height)
            x = int(center_x - w / 2)
            y = int(center_y - h / 2)

            boxes.append([x, y, w, h])
            confidences.append(float(confidence))
            class_ids.append(class_id)
            label = classes[class_id]
            plt.gca().add_patch(
            plt.Rectangle((x, y), w,
                          h, fill=False,
                          edgecolor=(0, 1, 1), linewidth=2)
            )
            plt.text(x, y - 10, label, color = (1, 0, 0), fontsize=20)

            print('object {} :'.format(i), label)
            i += 1

plt.show()


plt_img = cv2.cvtColor(img, cv2.COLOR_BGR2RGB)

fig = plt.gcf()
fig.set_size_inches(30, 20)

ax_img = plt.subplot(1, 2, 1)

ax_img.imshow(plt_img)

# jupyter 对每次运行结果会保留,再次运行一次
class_ids = []
confidences = []
boxes = []

i = 0

for out in outs:
    for detection in out:
        scores = detection[5:]
        class_id = np.argmax(scores)
        confidence = scores[class_id]
        if confidence > 0.5:
            center_x = int(detection[0] * width)
            center_y = int(detection[1] * height)

            w = int(detection[2] * width)
            h = int(detection[3] * height)
            x = int(center_x - w / 2)
            y = int(center_y - h / 2)

            boxes.append([x, y, w, h])
            confidences.append(float(confidence))
            class_ids.append(class_id)
            label = classes[class_id]
            plt.gca().add_patch(
            plt.Rectangle((x, y), w,
                          h, fill=False,
                          edgecolor=(0, 1, 1), linewidth=2)
            )
            plt.text(x, y - 10, label, color = (1, 0, 0), fontsize=20)

            print('object {} :'.format(i), label + ' '*(10 - len(label)), 'confidence :{}'.format(confidence))
            i += 1

print(confidences)
indexes = cv2.dnn.NMSBoxes(boxes, confidences, 0.5, 0.4)
print(indexes, end='')

ax_img = plt.subplot(1, 2, 2)
ax_img.imshow(plt_img)
for j in range(len(boxes)):
    if j in indexes:
        x, y, w, h = boxes[j]
        label = classes[class_ids[j]]
        plt.gca().add_patch(
            plt.Rectangle((x, y), w,
                          h, fill=False,
                          edgecolor=(0, 1, 1), linewidth=2)
            )
        plt.text(x, y - 10, label, color = (1, 0, 0), fontsize=20)


plt.show()
获得输出层的代码:
     layer_names = net.getLayerNames()
     print(layer_names)

     output_layers = [layer_names[i[0] - 1] for i in net.getUnconnectedOutLayers()]
     print(output_layers)
其中,getLayerNames函数获取网络各层名称;getUnconnectedOutLayers函数返回具有未连接输出的图层索引。
添加处理图像并获取blob的代码:
    img = cv2.imread("demo1.jpg")
    # 获取图像尺寸与通道值
    height, width, channels = img.shape
    print('The image height is:',height)
    print('The image width is:',width)
    print('The image channels is:',channels)

    blob = cv2.dnn.blobFromImage(img, 1.0 / 255.0, (416, 416), (0, 0, 0), True,
crop=False)
此时运行程序,打印的高度、宽度和通道数如下:
     The image height is: 2250
     The image width is: 4000
     The image channels is: 3
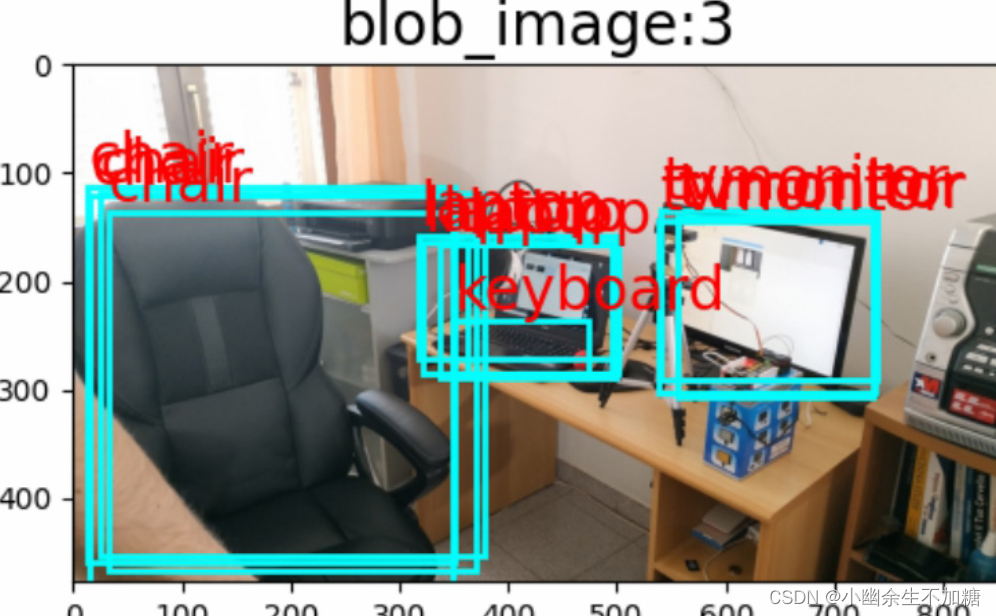
(添加Matplotlib可视化blob下的图像,代码如下:
from matplotlib import pyplot as plt
OpenCV采用的是BGR,Matplotlib采用的是RGB,需要使用cv2.COLOR_BGR2RGB将BGR转换为RGB。
利用setInput函数将blob输入网络,利用forward函数输入网络输出层的名字来计算网络输出。本次计算中output_layers包含3个输出层的列表,所以outs的值也是一个包含3个矩阵(array)的列表(list)。
这个循环会输出以下内容:
     The 0 layer out shape is: (507, 85)
     The 1 layer out shape is: (2028, 85)
     The 2 layer out shape is: (8112, 85)
然后进行识别与标签处理,创建记录数据列表。
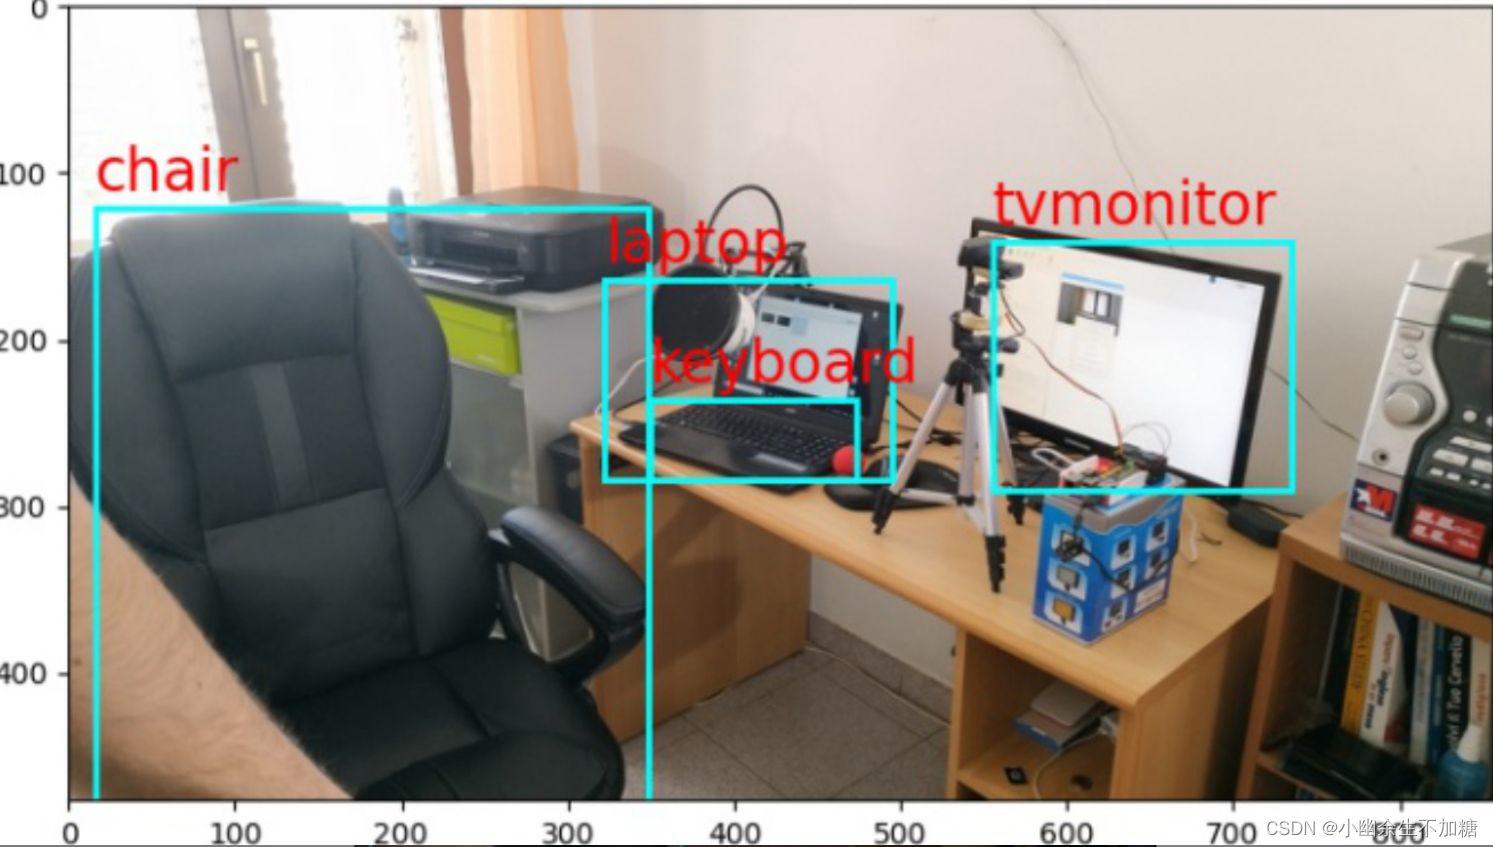
其中,class_ids记录类别名;confidences记录算法检测物体概率;boxes记录框的坐标。YOLOv3对于一个416×416的输入图像,在每个尺度的特征图的每个网格中设置3个先验框,总共有13×13×3 + 26×26×3 + 52×52×3 = 10647个预测。每一个预测是一个85(4+1+80)维向量,这个85维向量包含边框坐标(4个数值)、边框置信度(1个数值)、对象类别的概率(对于COCO数据集,有80种对象),所以我们通过detection[5:]获取detection的后80个数据(类似独热码),获取其最大值索引对应的coco.names类别。
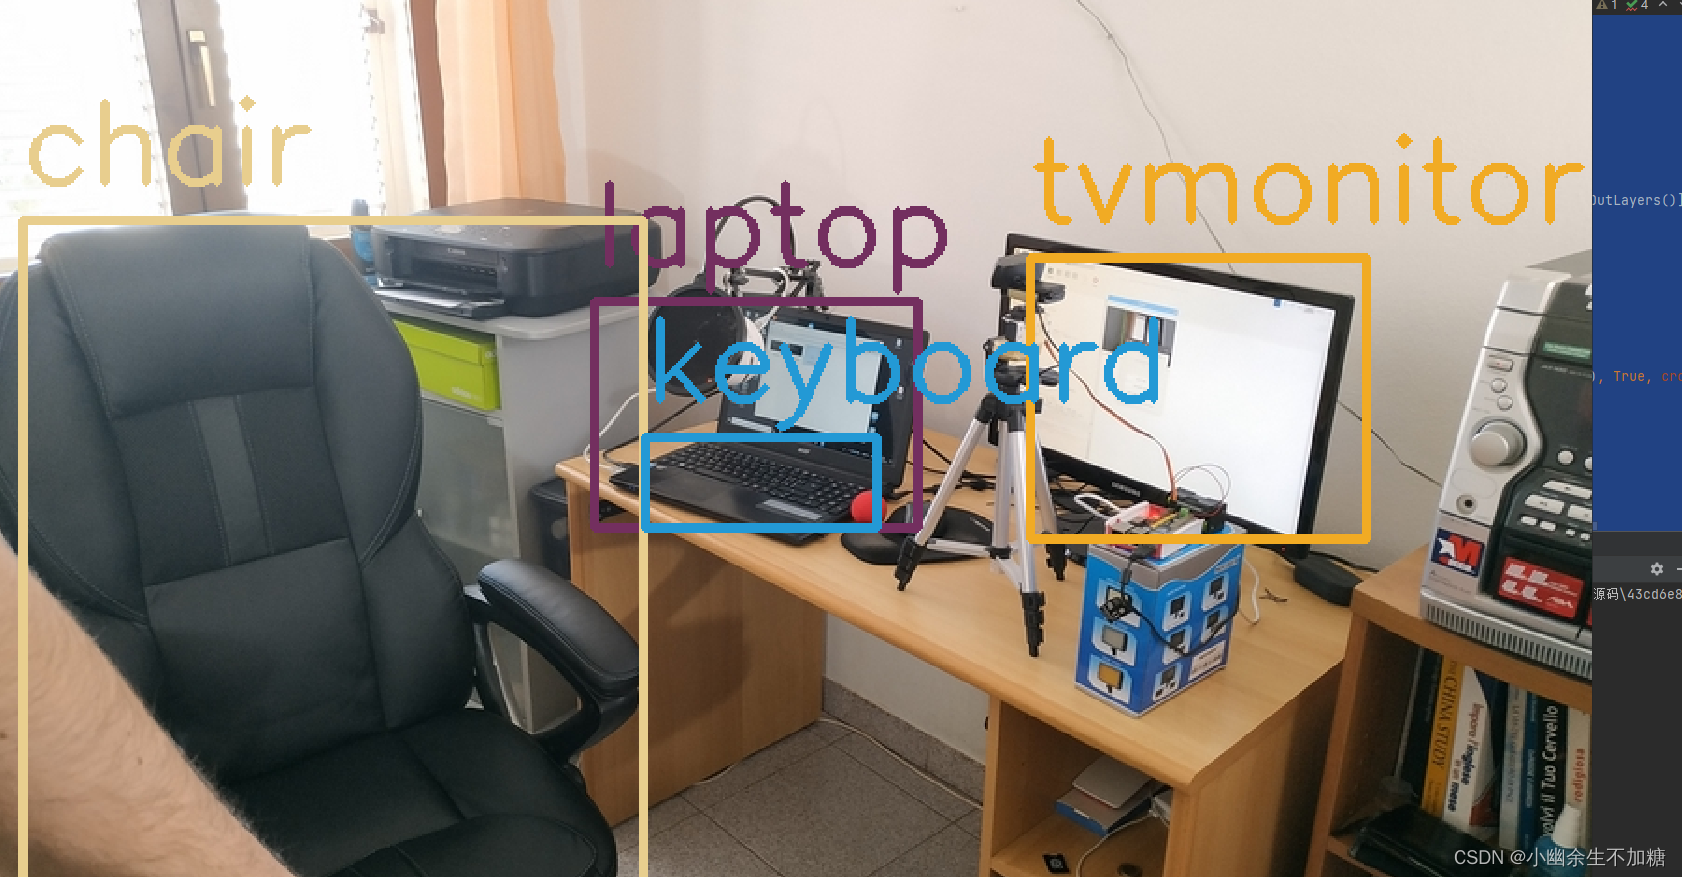
在检测中发现出现了双框(或者多框)效果。OpenCV dnn模块自带了NMSBoxes()函数,可以使用NMS算法解决多框问题。NMS的目的是在邻域内保留同一检测目标置信度最大的框,在下方输出中可以发现对于邻域相同的目标检测只保留了confidence值最大的box索引,例如object 0 : tvmonitor与object 3 : tvmonitor概率分别为0.9334805607795715与0.9716598987579346,显然保留了object 3 : tvmonitor,在索引indexes中没有[0]元素,其余推断类似。
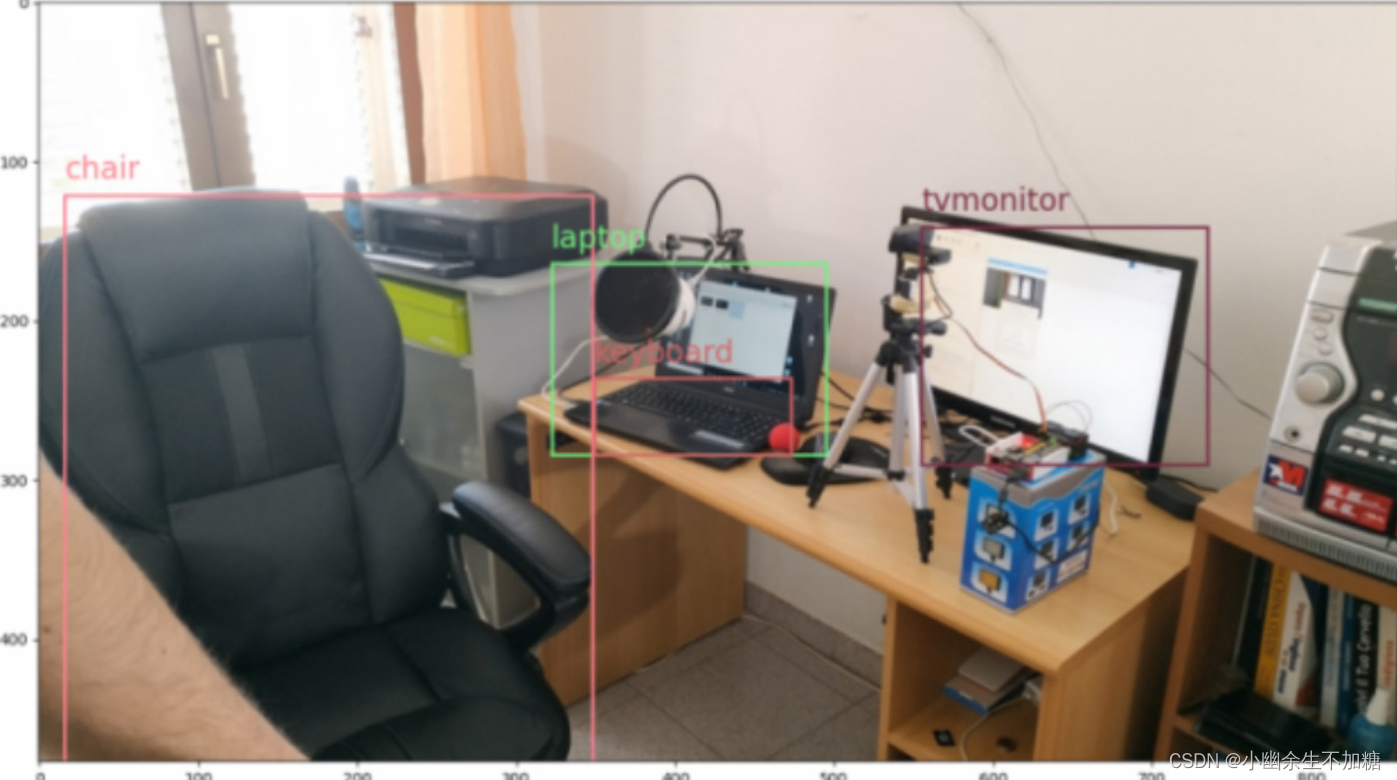
2.让不同类别物体的捕捉框颜色不同
代码:
import cv2
import numpy as np
from matplotlib import pyplot as plt

# Load Yolo
net = cv2.dnn.readNet("yolov3.weights", "yolov3.cfg")
classes = []
with open("coco.names", "r") as f:
    classes = [line.strip() for line in f.readlines()]

layer_names = net.getLayerNames()
output_layers = [layer_names[i[0] - 1] for i in net.getUnconnectedOutLayers()]

colors = np.random.uniform(0, 255, size=(len(classes), 3)) / 255

# Loading image
img = cv2.imread("demo1.jpg")
# img = cv2.resize(img, None, fx=0.4, fy=0.4)
height, width, channels = img.shape

# Detecting objects
blob = cv2.dnn.blobFromImage(img, 1.0 / 255.0, (416, 416), (0, 0, 0), True, crop=False)

net.setInput(blob)
outs = net.forward(output_layers)

# Showing informations on the screen
class_ids = []
confidences = []
boxes = []

fig = plt.gcf()
fig.set_size_inches(20, 10)
plt_img = cv2.cvtColor(img, cv2.COLOR_BGR2RGB)
plt.imshow(plt_img)

for out in outs:
    for detection in out:
        scores = detection[5:]
        class_id = np.argmax(scores)
        confidence = scores[class_id]
        if confidence > 0.5:
            # Object detected
            center_x = int(detection[0] * width)
            center_y = int(detection[1] * height)
            w = int(detection[2] * width)
            h = int(detection[3] * height)

            # Rectangle coordinates
            x = int(center_x - w / 2)
            y = int(center_y - h / 2)

            boxes.append([x, y, w, h])
            confidences.append(float(confidence))
            class_ids.append(class_id)

indexes = cv2.dnn.NMSBoxes(boxes, confidences, 0.5, 0.4)

for i in range(len(boxes)):
    if i in indexes:
        x, y, w, h = boxes[i]
        label = str(classes[class_ids[i]])
        color = colors[i]
        plt.gca().add_patch(
            plt.Rectangle((x, y), w,
                          h, fill=False,
                          edgecolor=color, linewidth=2)
            )
        plt.text(x, y - 10, label, color = color, fontsize=20)


plt.show()
运行结果:
3.不用Matplotlib实现目标检测
代码:
import cv2
import numpy as np

# Load Yolo
net = cv2.dnn.readNet("yolov3.weights", "yolov3.cfg")
classes = []
with open("coco.names", "r") as f:
    classes = [line.strip() for line in f.readlines()]
layer_names = net.getLayerNames()
output_layers = [layer_names[i - 1] for i in net.getUnconnectedOutLayers()]
colors = np.random.uniform(0, 255, size=(len(classes), 3))

# Loading image
img = cv2.imread("demo1.jpg")
height, width, channels = img.shape

# Detecting objects
blob = cv2.dnn.blobFromImage(img, 0.00392, (416, 416), (0, 0, 0), True, crop=False)

net.setInput(blob)
outs = net.forward(output_layers)

# Showing informations on the screen
class_ids = []
confidences = []
boxes = []
for out in outs:
    for detection in out:
        scores = detection[5:]
        class_id = np.argmax(scores)
        confidence = scores[class_id]
        if confidence > 0.5:
            # Object detected
            center_x = int(detection[0] * width)
            center_y = int(detection[1] * height)
            w = int(detection[2] * width)
            h = int(detection[3] * height)

            # Rectangle coordinates
            x = int(center_x - w / 2)
            y = int(center_y - h / 2)

            boxes.append([x, y, w, h])
            confidences.append(float(confidence))
            class_ids.append(class_id)

indexes = cv2.dnn.NMSBoxes(boxes, confidences, 0.5, 0.4)

font = cv2.FONT_HERSHEY_SIMPLEX
for i in range(len(boxes)):
    if i in indexes:
        x, y, w, h = boxes[i]
        label = str(classes[class_ids[i]])
        color = colors[i]
        cv2.rectangle(img, (x, y), (x + w, y + h), color, 3)
        cv2.putText(img, label, (x, y - 20), font, 2, color, 3)

cv2.namedWindow("Image",0)
cv2.resizeWindow("Image", 1600, 900)
cv2.imshow("Image", img)
cv2.waitKey(0)
cv2.destroyAllWindows()
输出结果: