这几天做了一些提取一个点时间序列的工作,本文第一个代码记录了提取三个点的NDVI值时间序列的代码,并且记录了以csv格式保存结果到本地的方法。第二个代码记录了将一个点的时间序列以折线图的形式打印在控制台中。
一、输入点坐标
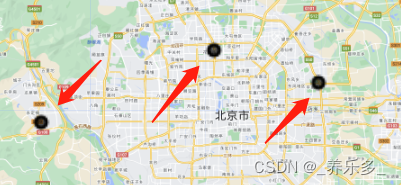
输入三个点的数据。
二、结果展示
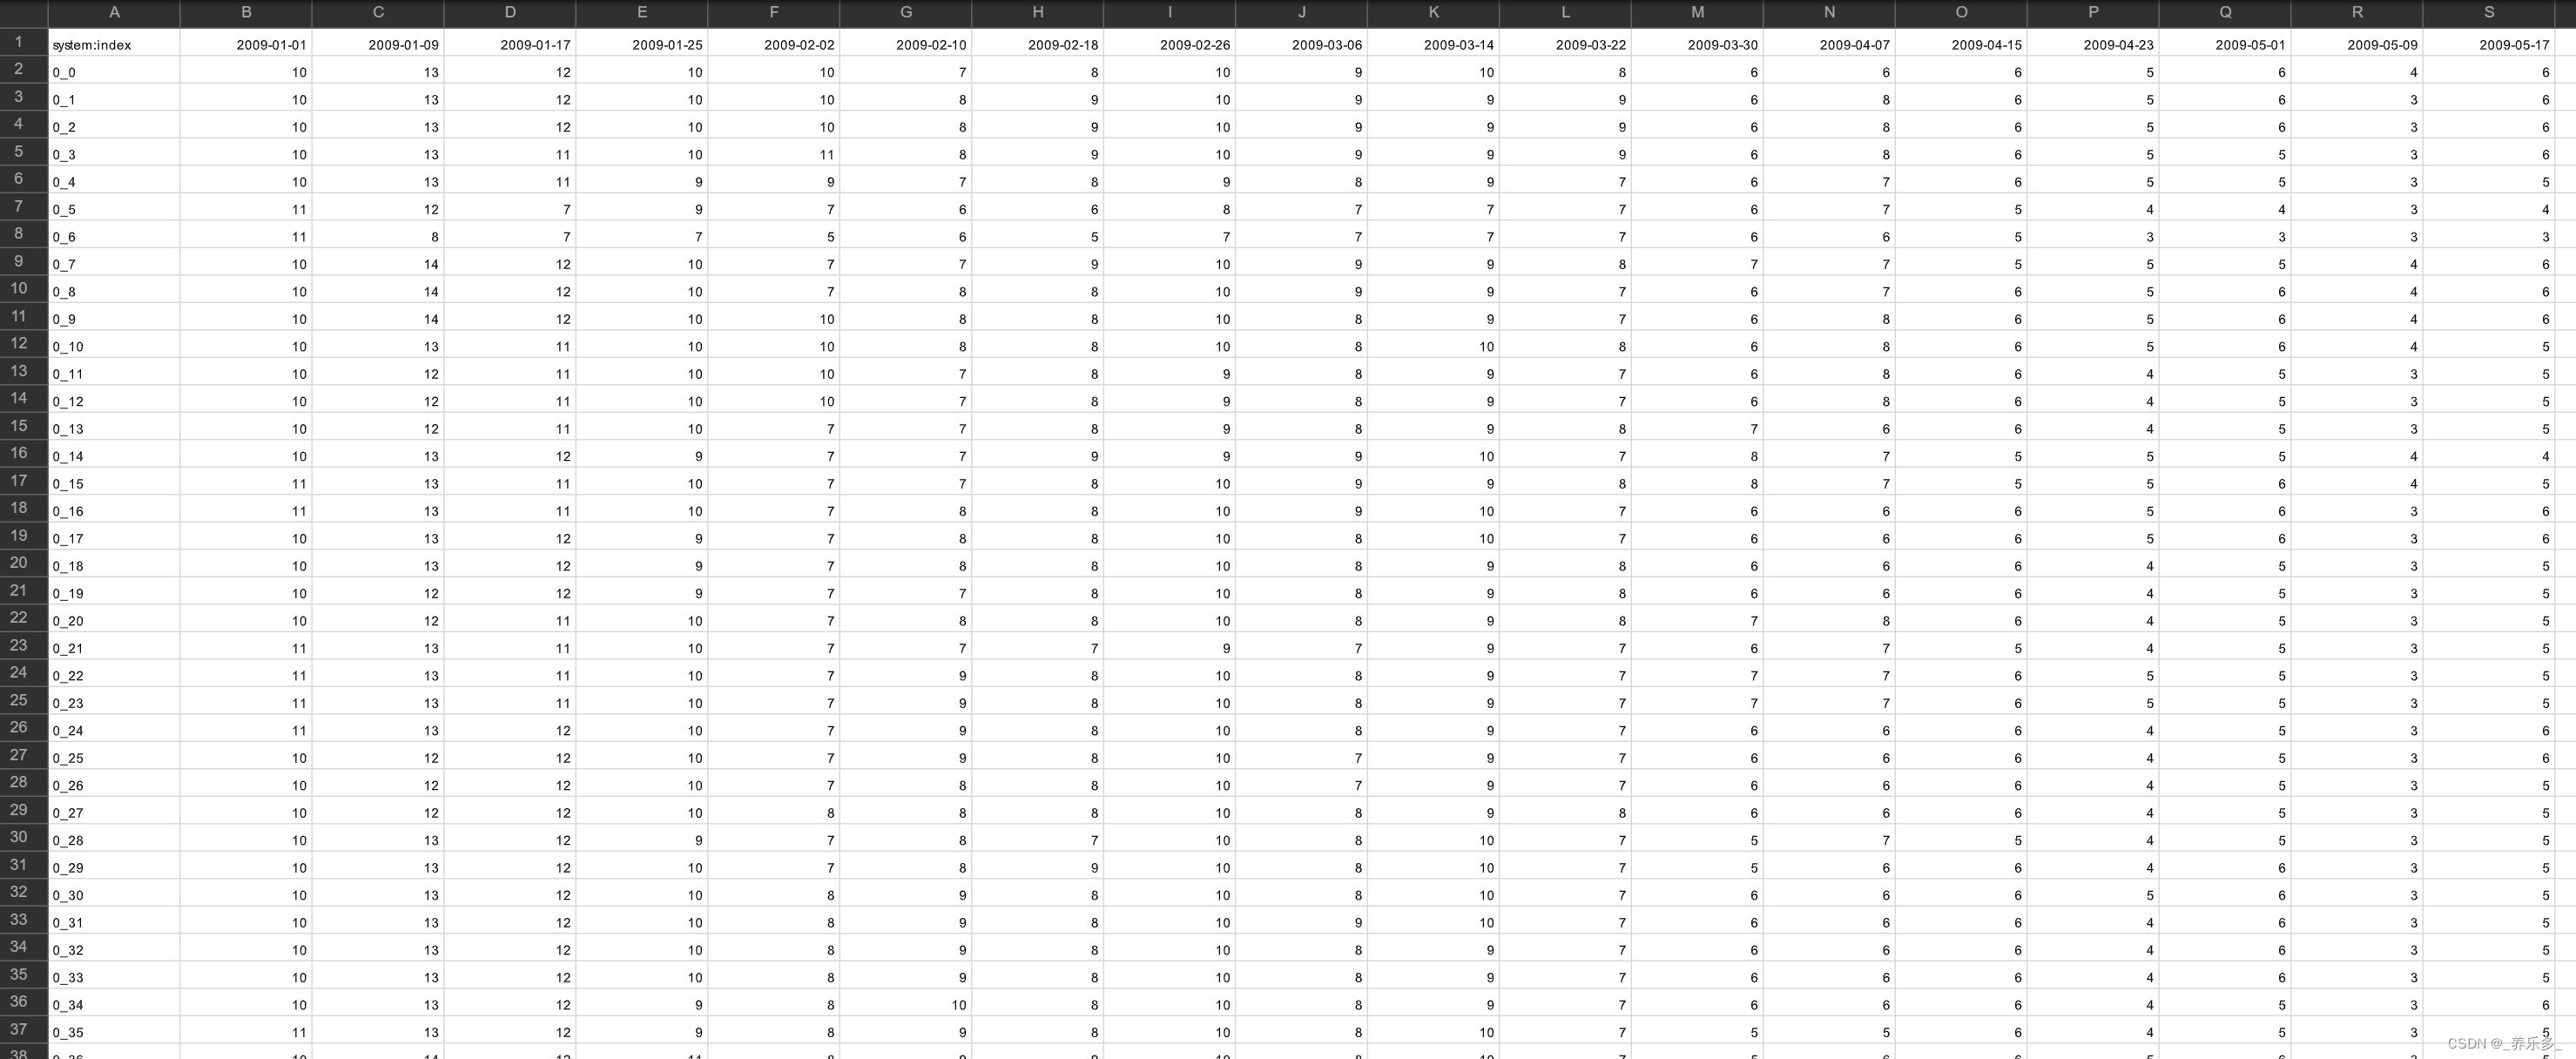
每一个点的LAI时间序列都保存在了csv表格之中,如下图所示。‘索引’对应点的索引,代码中已经将点的列表打印出来,可以对应索引检索。每一列都是时间。
三、代码实现
主要的代码如下所示,可以直接运行。
//将点坐标转换成FeatureCollection,这里添加三个点
var col=ee.List([[116.379, 39.98], [116.116, 39.896], [116.5393, 39.9414]]);
var point = ee.FeatureCollection(ee.Geometry.MultiPoint(col));
print("point", point)

//加载矢量图层
Map.centerObject(point);
Map.addLayer(point, {

    }, 'geometry')

//影像集合筛选
var dataset = ee.ImageCollection("MODIS/061/MOD13A2")
                .filterDate('2004-01-01', '2014-12-31')
                .select('NDVI')
                .toBands()

//统计其给出的样本点的NDVI
var pixelValues = dataset.sampleRegions({


			    collection: point,
			    scale: 30, //每个点的缓冲区大小
});

print("NDVIValue", pixelValues)

//将影像导出
Export.table.toDrive({


			    collection: pixelValues,
			    description:"NDVIPointsTimeSerises30m",
			    folder: "NDVITS",
			    fileFormat: "CSV"
});
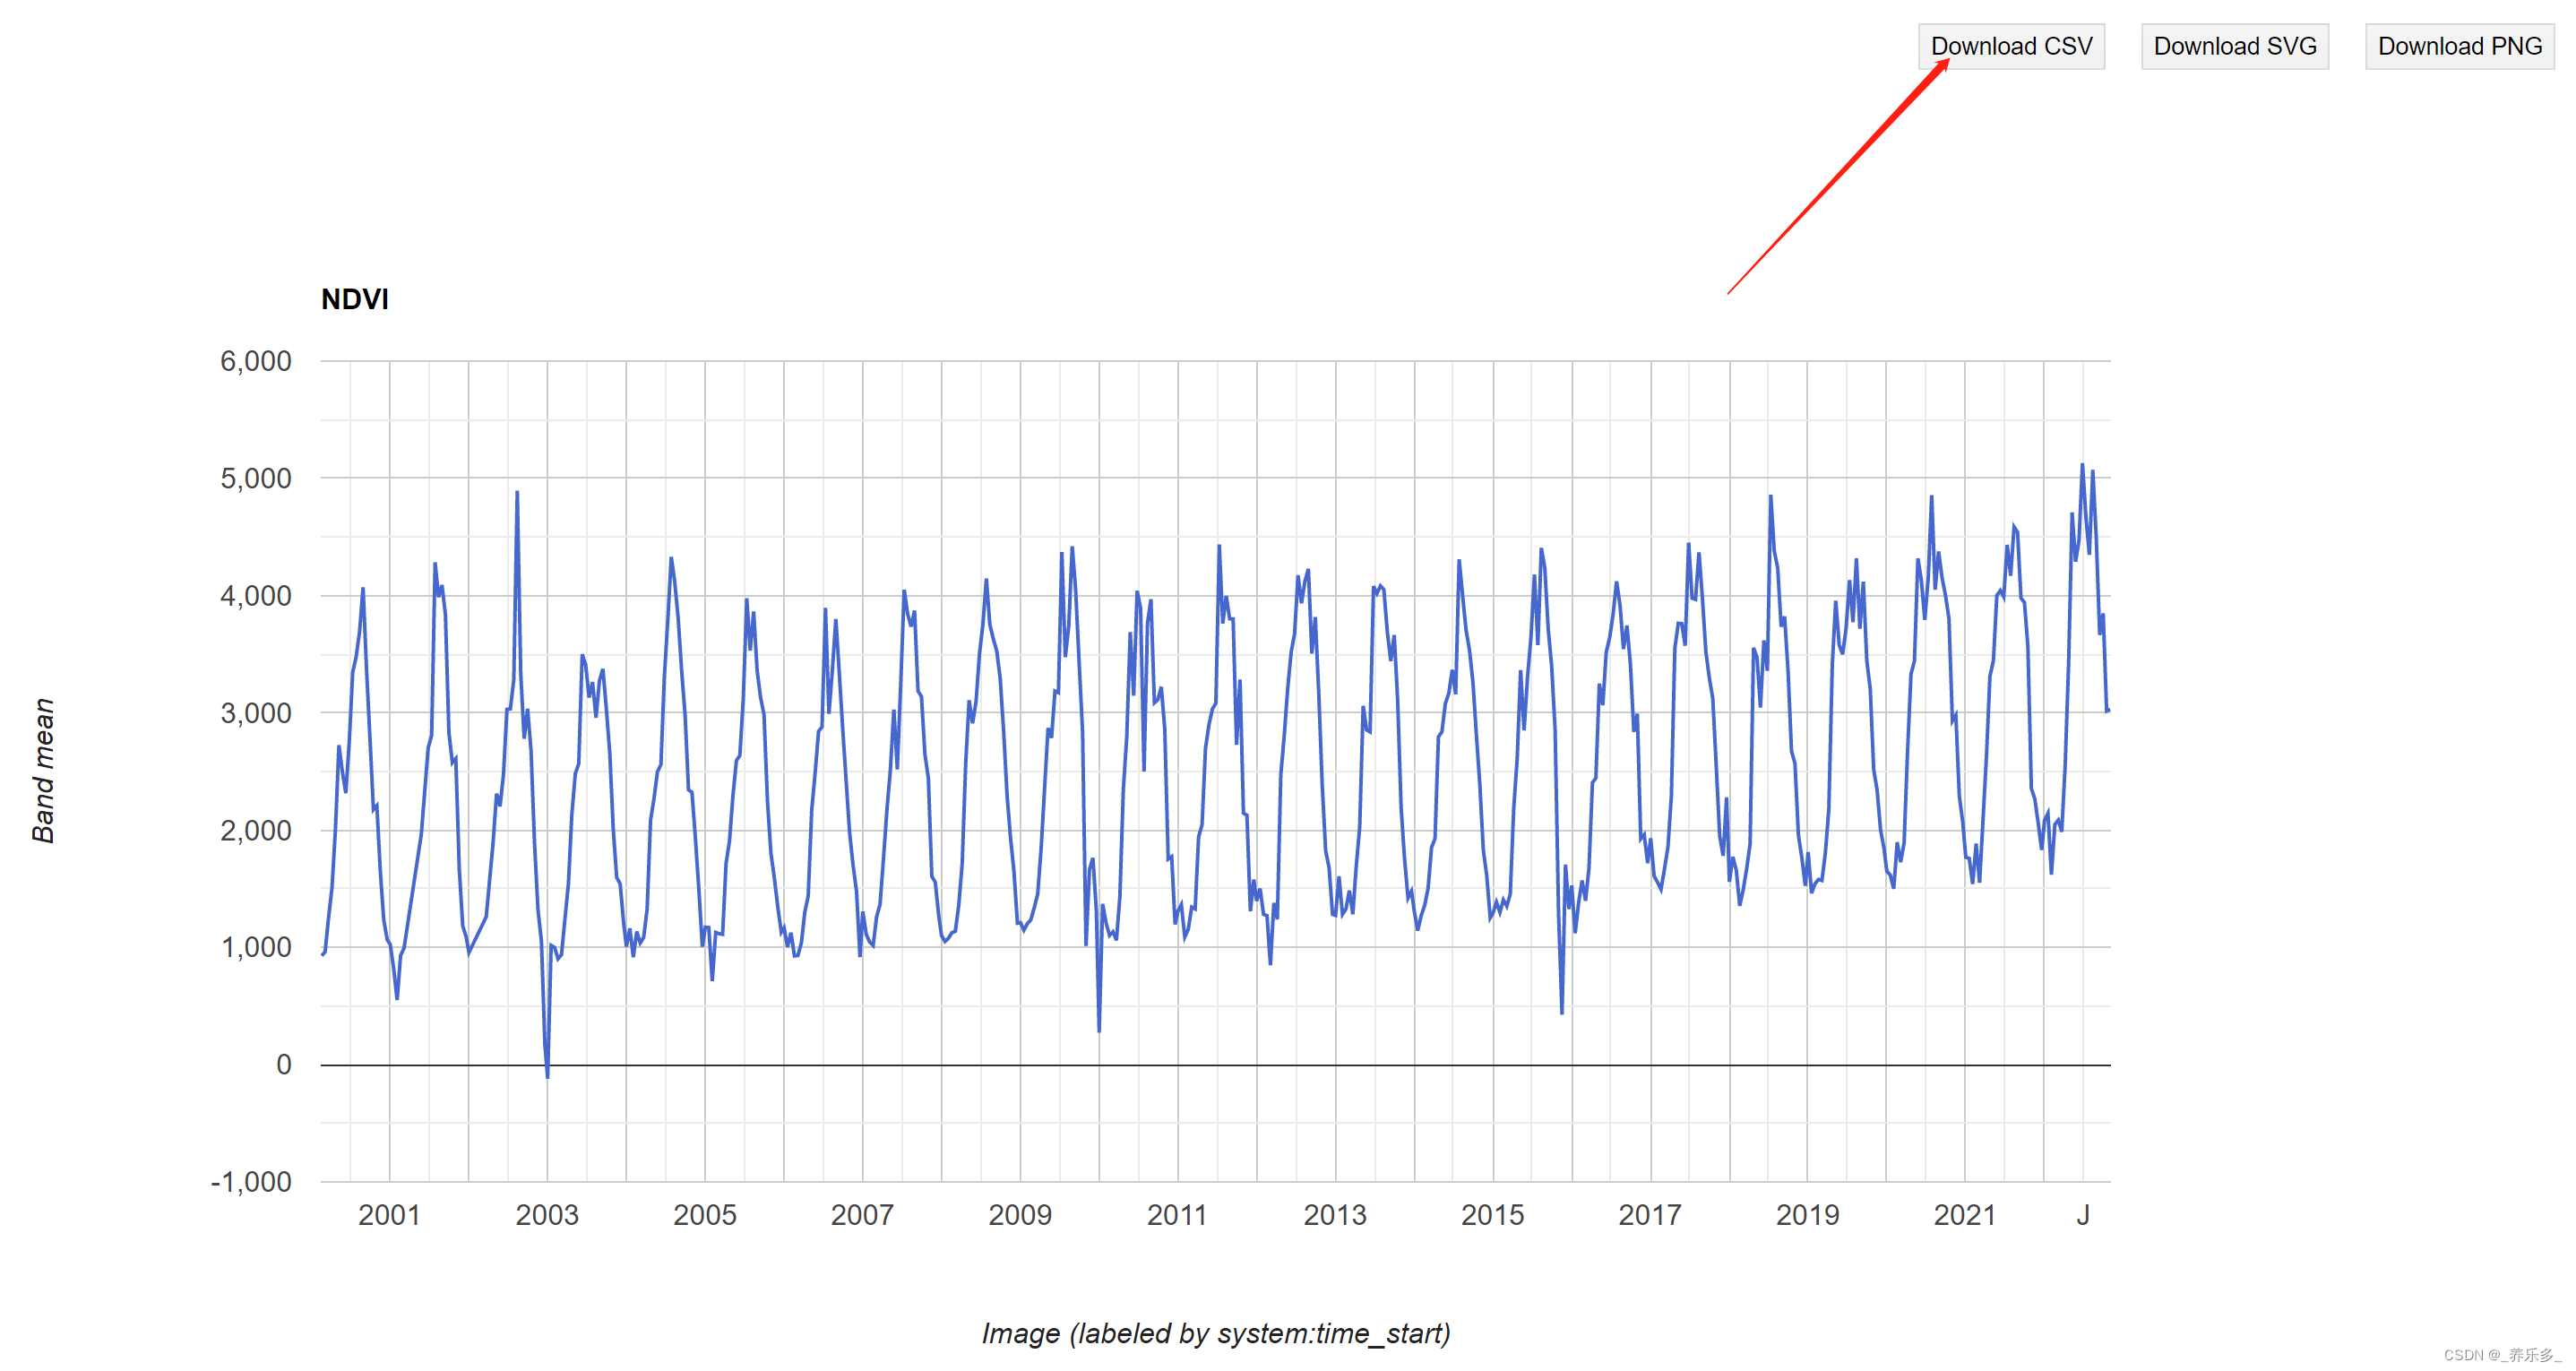
四、打印时间序列到控制台
红色箭头按钮下载时间序列数据到,csv。
代码如下所示:
var point = ee.Geometry.Point([116.379, 39.98]);

//影像集合筛选
var dataset = ee.ImageCollection("MODIS/061/MOD13A2")
                .filterDate('2004-01-01', '2014-12-31')
                .select('NDVI')

// 创建折线图
var chart = ui.Chart.image.series({


			    imageCollection: dataset.select('NDVI'),
			    region: point,
			    //reducer: ee.Reducer.max(),
			    scale: 500
}).setOptions({

    title: 'NDVI'});

// 可视化折线图
print(chart);
五、代码链接
三个点的NDVI值时间序列:https://code.earthengine.google.com/cb661539564f4704db2a5acb3f2504ab?noload=true
打印一个点的时间序列到控制台:https://code.earthengine.google.com/9c232090cc07e170514c50ae0d379d3f?noload=true