完整代码:https://gitee.com/Ilovesandwich/fx_house_price,实现效果见下
前言
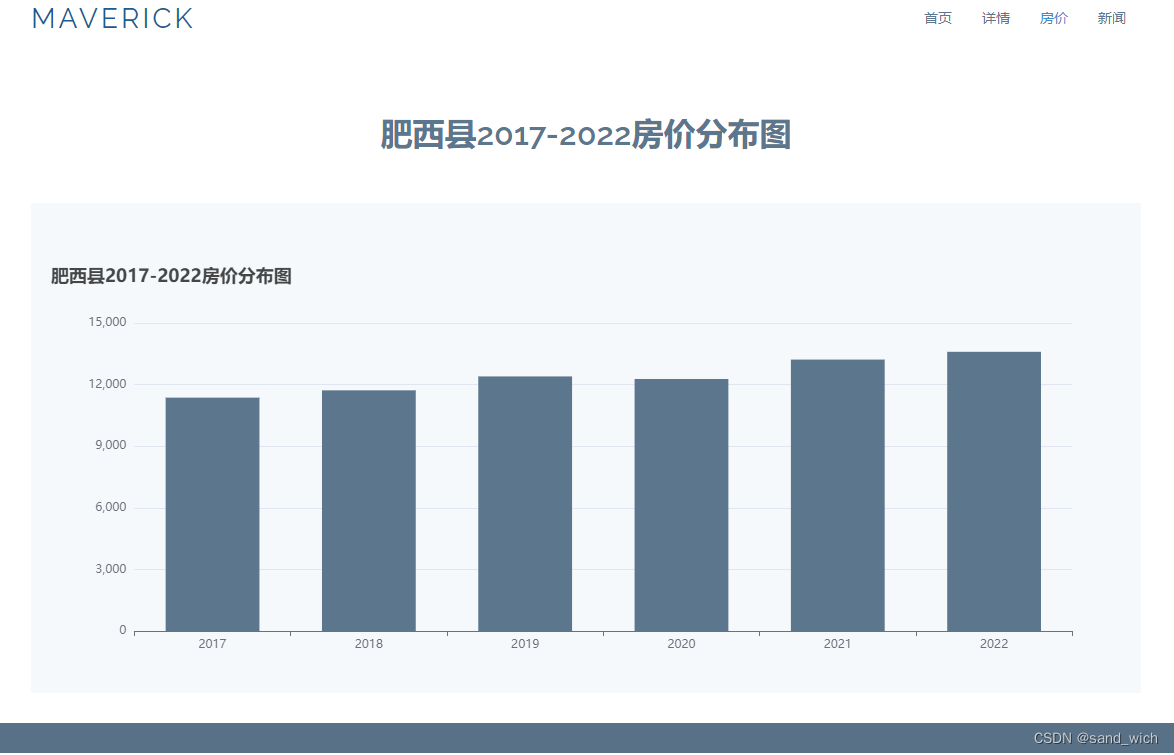
应用Python爬虫、Flask框架、Echarts等技术实现,记录肥西2017-2022年房价的变化,相关新闻以及原因分析
一、爬取房价数据
二、使用步骤
1.引入库
代码如下:
import requests
from bs4 import BeautifulSoup
from numpy import *
import parsel
import random
import time
import csv
import re
from lxml import etree
2.创建文件对象
代码如下 :
f = open('F:/肥西2017-2022年房价.csv', 'w',
         encoding='utf-8-sig', newline="")  # 创建文件对象
csv_write = csv.DictWriter(f, fieldnames=['年份', '月份', '每月价格','均价'])
csv_write.writeheader()  # 写入文件头
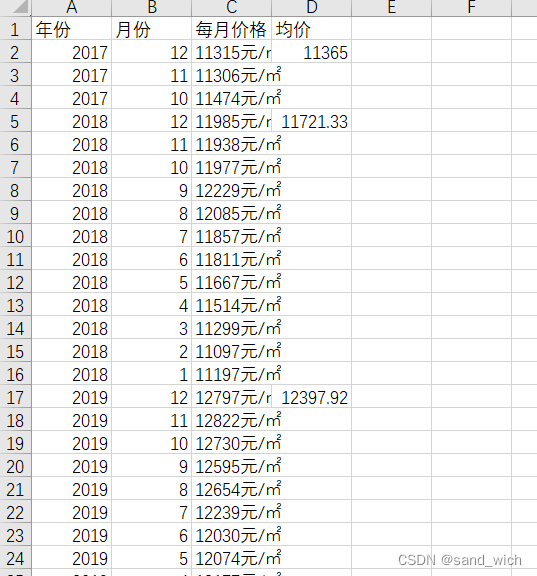
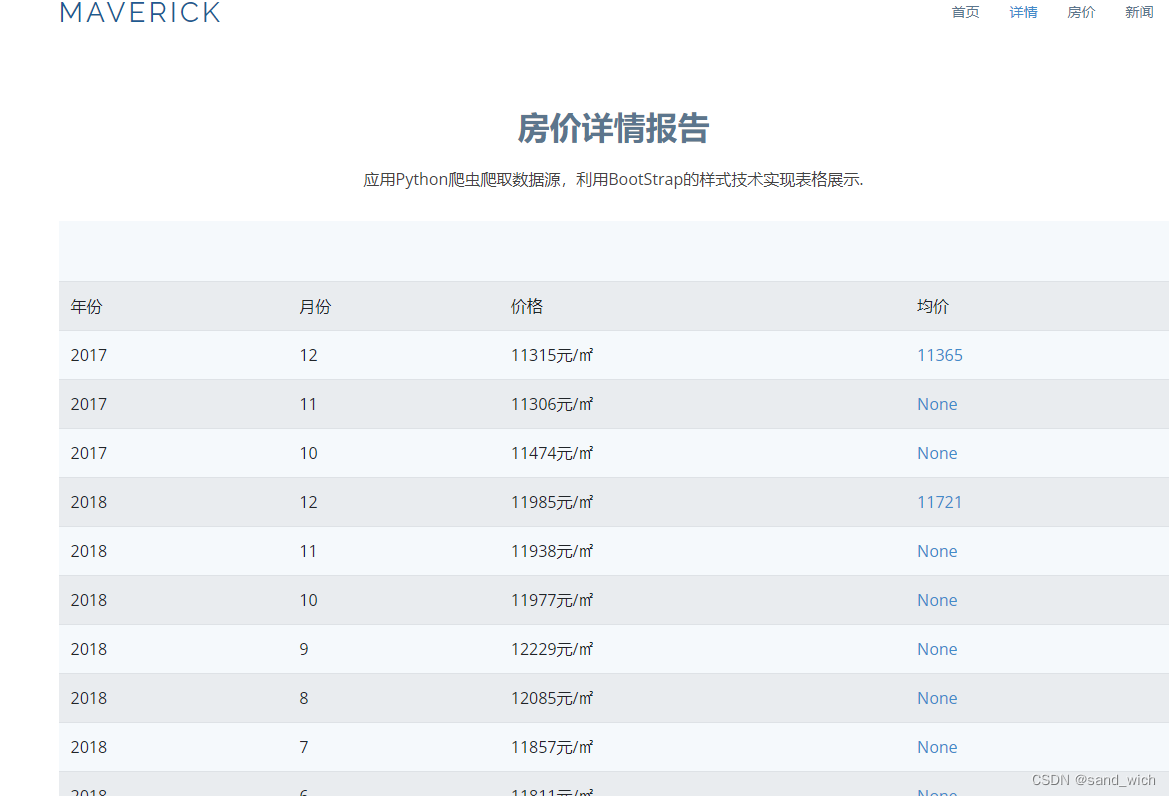
在f盘创建一个csv文件用来保存数据,数据分为4列,分别是【‘年份’, ‘月份’, ‘每月价格’,‘均价’】
3. 连接请求
headers = {


    'User-Agent': 'Mozilla/5.0 (Windows NT 10.0; Win64; x64) AppleWebKit/537.36 (KHTML, like Gecko) Chrome/109.0.0.0 Safari/537.36'
}

x = 2017
z= 0
#源地址
for i in range(2017, 2023):
    print('爬取{}年'.format(i))
    t_url = 'https://www.anjuke.com/fangjia/hf{}/feixixiancheng/'.format(i)
    #print(t_url)
    response = requests.get(url=t_url, headers=headers)
   # print(response)
    html_data = response.text
    tree = etree.HTML(html_data)
设置请求头,爬取每一年的该年数据,语法
{}.format(i)
```
每一年的数据爬取成功会设置了一个print用来判断。

获取网页中的年份

```py
year = tree.xpath("//div[@class='fjlist-box boxstyle2']/h3/text()")
获取网页中的月份
   month = tree.xpath(
        "//div[@class='fjlist-box boxstyle2']//a[@class='nostyle']/b/text()")
    number = [x[5:7] for x in month]
    length = len(number)
    res = 13-length
[x[5:7] for x in month]是为了截取年份,原本的数据是"2022年12月房价"
 res = 13-length是因为某些年份特殊,数据并没有记录12个月全年,有缺失月份
获取网页中的价格,计算均价的代码就简单暴力了,直接转int然后计算平均值
 price = []
    y = 0
    currentprice = tree.xpath(
        "//div[@class='fjlist-box boxstyle2']//a[@class='nostyle']/span/text()")
    #单独提出价格数字
    pricenumber = [x[0:5] for x in currentprice]
    #print(len(currentprice))
    leng = len(currentprice)
    #计算平均价格
    a = 0
    for i in range(0,leng):
        a += int(pricenumber[i])
    #将平均价格放入每年的第一个月的行里,其他数值都是None
    a = round(a/leng, 2)
    for i in range(0,leng):
        if i == 0:
            price.append(a)
        else :
            price.append(None)
最后将数据写入csv文件中
    # 将数据读入csv文件
    #每一年的
    for j in range(0, length):

       data_dict = {

    '年份': x,  '月份': number[j], '每月价格': currentprice[j],'均价': price[j]}
       csv_write.writerow(data_dict)
    print('第{}年的数据加载完成'.format(x))
    x += 1


print('--------------------------')
print('全部爬取成功!')
完整代码
import requests
from bs4 import BeautifulSoup
from numpy import *
import parsel
import random
import time
import csv
import re
from lxml import etree


#创建文件对象
f = open('F:/肥西2017-2022年房价.csv', 'w',
         encoding='utf-8-sig', newline="")  # 创建文件对象
csv_write = csv.DictWriter(f, fieldnames=['年份', '月份', '每月价格','均价'])
csv_write.writeheader()  # 写入文件头

#设置请求头
headers = {


    'User-Agent': 'Mozilla/5.0 (Windows NT 10.0; Win64; x64) AppleWebKit/537.36 (KHTML, like Gecko) Chrome/109.0.0.0 Safari/537.36'
}

x = 2017
z= 0
#源地址
for i in range(2017, 2023):
    print('爬取{}年'.format(i))
    t_url = 'https://www.anjuke.com/fangjia/hf{}/feixixiancheng/'.format(i)
    #print(t_url)
    response = requests.get(url=t_url, headers=headers)
   # print(response)
    html_data = response.text
    tree = etree.HTML(html_data)

#年分
    year = tree.xpath("//div[@class='fjlist-box boxstyle2']/h3/text()")
   # print(year[0])

   # print('--------------------------')

#月份
    month = tree.xpath(
        "//div[@class='fjlist-box boxstyle2']//a[@class='nostyle']/b/text()")
    number = [x[5:7] for x in month]
    length = len(number)
    res = 13-length

#价格

    price = []
    y = 0
    currentprice = tree.xpath(
        "//div[@class='fjlist-box boxstyle2']//a[@class='nostyle']/span/text()")
    #单独提出价格数字
    pricenumber = [x[0:5] for x in currentprice]
    #print(len(currentprice))
    leng = len(currentprice)
    #计算平均价格
    a = 0
    for i in range(0,leng):
        a += int(pricenumber[i])
    #将平均价格放入每年的第一个月的行里,其他数值都是None
    a = round(a/leng, 2)
    for i in range(0,leng):
        if i == 0:
            price.append(a)
        else :
            price.append(None)
    # 将数据读入csv文件
    #每一年的
    for j in range(0, length):

       data_dict = {

    '年份': x,  '月份': number[j], '每月价格': currentprice[j],'均价': price[j]}
       csv_write.writerow(data_dict)
    print('第{}年的数据加载完成'.format(x))
    x += 1


print('--------------------------')
print('全部爬取成功!')
4、将csv文件转sql文件
具体操作找一下相关博客吧,我如果闲了会补充下
5、初步的pandas画图
import csv
import matplotlib.pyplot as plt
import pandas as pd
import numpy as np
plt.rcParams['font.sans-serif'] = ['SimHei']
plt.rcParams['font.family'] = 'sans-serif'
plt.rcParams['axes.unicode_minus'] = False
with open('F:/肥西2017-2022年房价.csv', 'r', encoding='utf-8') as f:
f_csv = csv.reader(f)
headers = next(f_csv)
# for row in f_csv:
# print(row)
readData = pd.read_csv("F:/肥西2017-2022年房价.csv", skiprows=0) # 读取csv数据
#打印
print(readData)
#[64 rows x 3 columns]
xdata = []
ydata = []
xdata = readData.loc[:, '年份']
ydata = readData.loc[:, '均价']
data = readData.iloc[:, 2].tolist() # 获取dataFrame中的第3列,并将此转换为list
#Data = readData.iloc[0, 1].tolist()
xData = list(range(1, len(data)+1)) # 产生横轴坐标
print('--------------------------------')
print(data)
#画的是年表
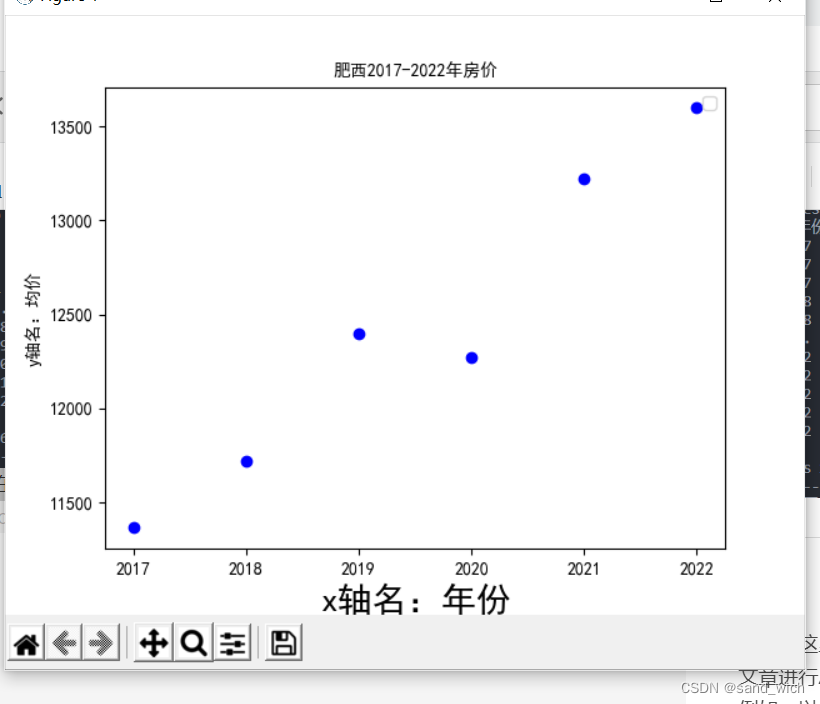
plt.plot(xdata, ydata, 'bo-', label=u'', linewidth=1)
plt.title(u"肥西2017-2022年房价", size=10) # 设置表名为“表名”
plt.legend()
plt.xlabel(u'x轴名:年份', size=20) # 设置x轴名为“x轴名”
plt.ylabel(u'y轴名:均价', size=10) # 设置y轴名为“y轴名”
plt.show()
#还应有个月表
最后的结果是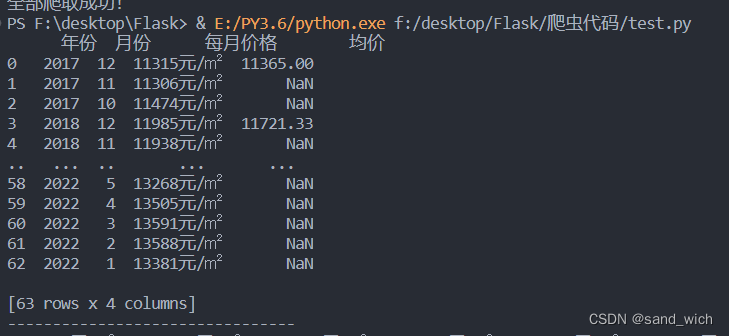
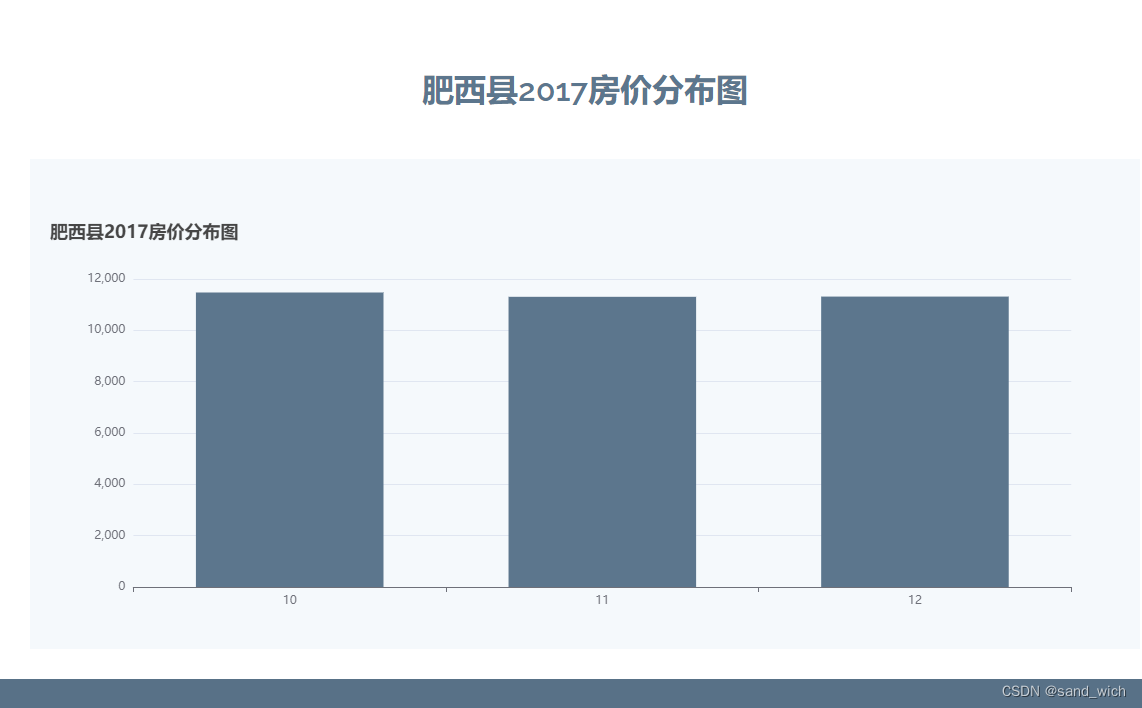
散点图挺丑的,之后是学着用echart重新绘制
三、echart

总结
代码传到了gitee结果不允许开源只能作为私人仓库,可恶。