Python房价分析和可视化<fangtianxia新房>
本文是Python数据分析实战的房价分析系列,选择了二线城市贵阳。
数据获取
本文的数据来源于2022年8月房天下的新房数据。对数据获取不感兴趣可以跳过此部分看分析和可视化。
1.访问目标页面
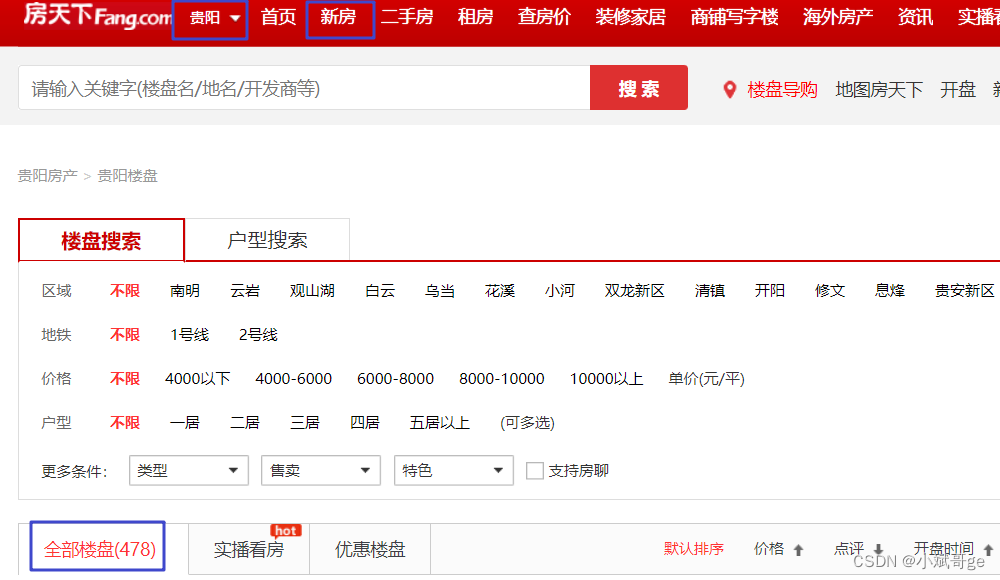
进入fangtianxia首页,点击选择城市和新房进入<楼盘信息页面>,页面上的筛选条件(位置、价格等)都保持默认,这样可以查出全部楼盘信息。
 2.分析url变化
拖动滚动条到翻页的地方,点击几次<上一页>、<下一页>翻页,观察浏览器上方搜索框里url的变化。可以看到每次翻页url只变化一个数字,对应当前的页数。
所以只要不断改变url中的页数,就可以获取所有的数据。
3.获取楼盘总数和每页楼盘数
楼盘总数在页面上可以直接看到,代码中可以直接写死。如果代码以后还会重复使用,最好从HTML文件中提取,这样无论数量怎么变化,代码都能与实际的数量保持一致。
参考代码:
import requests
import re

url = 'https://gy.newhouse.fang.com/house/s/'
res = requests.get(url, headers=headers)
number = re.findall('>共.*?>(.*?)<.*?条<', res.text)[0]
每页的数量直接在页面上数,fangtianxia新房数据是每页20条。
用总数除每页数量可以得到总页数,总页数就是需要获取的页面数量。
4.循环拼接url获取所有数据
根据总页数,在url中从1开始拼接页数,依次获取所有页面的信息。
参考代码:
import time

number = get_newhouse_total_number()
page = int(number)//20 + 1
for p in range(1, page+1):
    time.sleep(1)
    new_house_url = 'https://gy.newhouse.fang.com/house/s/b9{}'.format(p)
    try:
        res = requests.get(new_house_url, headers=headers)  # headers需要自己准备
        print('获取第{}页数据成功'.format(p))
    except Exception as e:
        print('获取第{}页数据失败,报错:{}'.format(p, e))
5.用XPath提取数据
楼盘信息在返回结果的HTML文件中,使用XPath语法提取。
参考代码:
from lxml import etree

result = res.text
html = etree.HTML(result)
infos = html.xpath("//li[contains(@id, 'lp_')]")
XPath快速入门参考:快速入门XPath语法,轻松解析爬虫时的HTML内容
用XPath获取当前页的所有楼盘信息保存在infos中,infos是一个Element对象的列表,每一个Element对象里的信息是一个楼盘的信息,可以继续用XPath从中提取具体的信息。
6.将数据保存到excel中
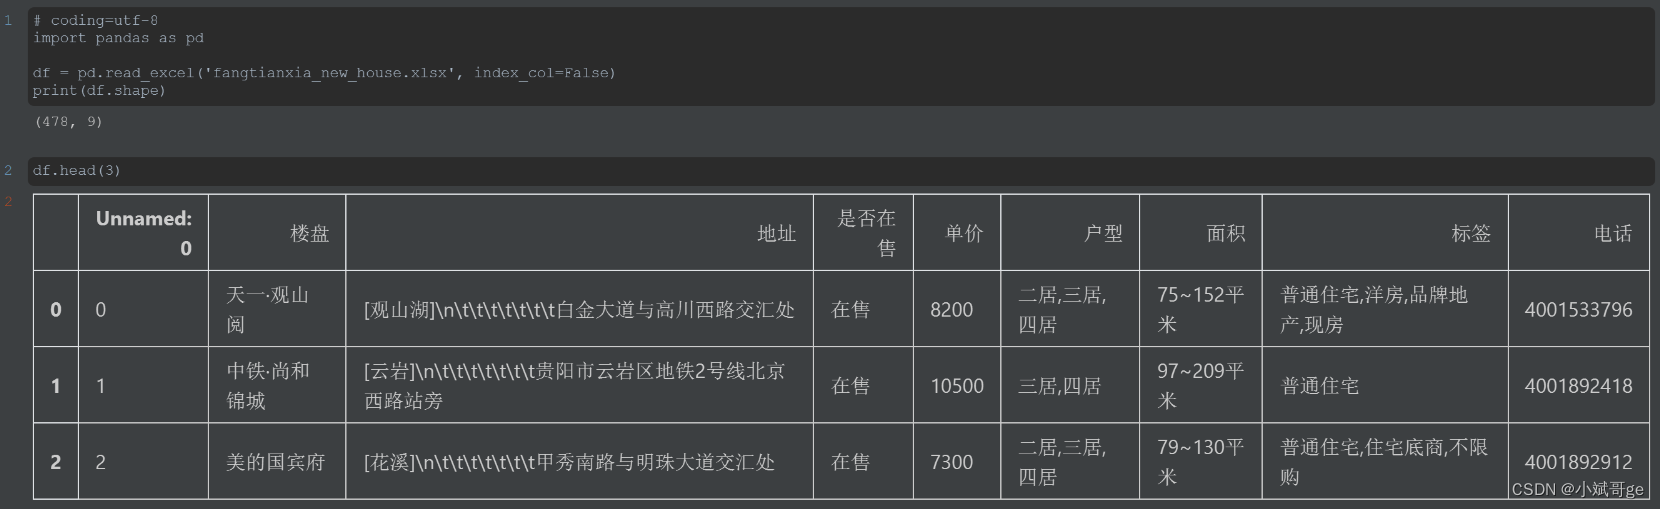
使用pandas将解析的数据转换成DataFrame,然后保存到excel中。最终获取到的数据共478条。
数据清洗
1.删除“售完”和还是“地块”的楼盘
# coding=utf-8
import pandas as pd
import numpy as np
import re

# 数据清洗
df = pd.read_excel('fangtianxia_new_house.xlsx', index_col=False)
print(df.shape)
df_new = df.drop(df.loc[df['是否在售']=='售完'].index).drop(df.loc[df['是否在售']=='地块'].index)
print(df_new.shape)
(478, 9)
(359, 9)
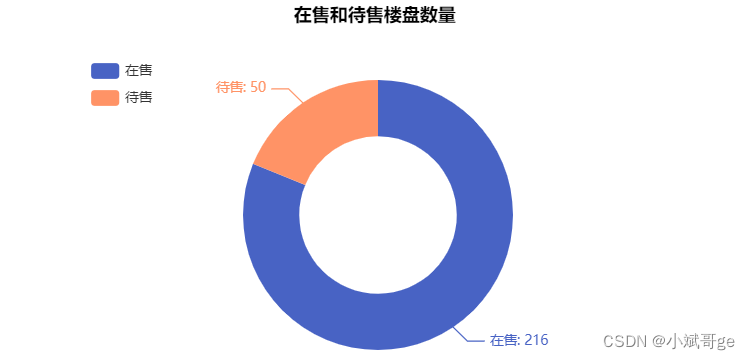
删除“售完”楼盘和还是“地块”的楼盘后,剩下了359条数据,这359条数据是“在售”和“待售”楼盘。
2.删除“价格待定”的楼盘
index = [row_index for row_index, row_data in df_new.iterrows() if re.findall(r'(价格待定.*)', row_data['单价'])]
df_new = df_new.drop(index)
print(df_new.shape)
(266, 9)
删除“价格待定”的楼盘后,剩下266条楼盘数据。
3.填充缺失值
print(np.any(df_new.isnull()))
df_new.fillna('未知', inplace=True)
print(np.any(df_new.isnull()))
True
False
4.删除重复值
df_new.drop_duplicates('楼盘', inplace=True)
print(df_new.shape)
(266, 9)
266条数据中没有重复值,本文就基于这266个楼盘的数据进行分析。
在售和待售楼盘数量
from pyecharts.charts import Pie
from pyecharts import options as opts

# 获取在售和待售的数量
is_sale_counts = df_new['是否在售'].value_counts()
pie = Pie(init_opts=opts.InitOpts(width='600px', height='400px', bg_color='white'))
pie.add(
    '', [list(z) for z in zip([gen for gen in is_sale_counts.index], is_sale_counts)],
    radius=['35%', '60%'], center=['60%', '60%']
).set_series_opts(
    label_opts=opts.LabelOpts(formatter="{b}: {c}"),
).set_global_opts(
    title_opts=opts.TitleOpts(title='在售和待售楼盘数量', pos_left='280', pos_top='50',
        title_textstyle_opts=opts.TextStyleOpts(color='black', font_size=16)),
    legend_opts=opts.LegendOpts(pos_left='100', pos_top='100', orient='vertical')
).set_colors(['#4863C4', '#FF9366']).render('is_sale_counts.html')
在售和待售楼盘均价
from pyecharts.charts import Bar
from pyecharts import options as opts
from pyecharts.commons.utils import JsCode

# 计算在售和待售楼盘的均价
df_new['单价'] = df_new['单价'].values.astype(int)
is_sale_price = df_new.loc[df_new['是否在售']=='在售', '单价'].mean()
stay_sale_price = df_new.loc[df_new['是否在售']=='待售', '单价'].mean()
color_function = """function (params) {if (params.value < 10000) return '#4863C4'; else return '#FF9366';}"""
bar = Bar(init_opts=opts.InitOpts(width='800px', height='400px', bg_color='white'))
bar.add_xaxis(['待售', '在售']).add_yaxis(
    '', ['%.2f' % stay_sale_price, '%.2f' % is_sale_price], category_gap=80,
    itemstyle_opts=opts.ItemStyleOpts(color=JsCode(color_function))
).reversal_axis().set_series_opts(
    # 设置数字标签的样式
    label_opts=opts.LabelOpts(position='right', font_size=24,
        formatter=JsCode("function (params) {return params.value}"))
).set_global_opts(
    # 设置标题和横纵坐标的样式
    title_opts=opts.TitleOpts(title='在售和待售楼盘均价(元/㎡)', pos_left='250', pos_top='30',
        title_textstyle_opts=opts.TextStyleOpts(color='black', font_size=16)),
    xaxis_opts=opts.AxisOpts(is_show=False, max_=13000),
    yaxis_opts=opts.AxisOpts(axislabel_opts=opts.LabelOpts(font_size=24))
).render('is_sale_price.html')
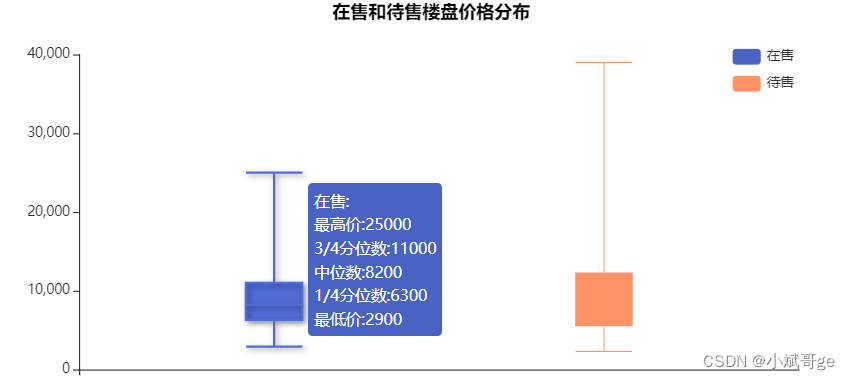
 在售和待售楼盘价格分布

from pyecharts.charts import Boxplot
from pyecharts import options as opts
from pyecharts.commons.utils import JsCode

# 获取在售和待售楼盘的单价
df_new['单价'] = df_new['单价'].values.astype(int)
is_sale_price = df_new.loc[df_new['是否在售']=='在售', '单价']
stay_sale_price = df_new.loc[df_new['是否在售']=='待售', '单价']
content_function = """function(param) {return ['在售:','最高价:' + param.data[5],'3/4分位数:' + param.data[4],
'中位数:' + param.data[3], '1/4分位数:' + param.data[2],'最低价:' + param.data[1]].join('<br/>')}"""
content_function2 = """function(param) {return ['待售:','最高价:' + param.data[5],'3/4分位数:' + param.data[4],
'中位数:' + param.data[3], '1/4分位数:' + param.data[2],'最低价:' + param.data[1]].join('<br/>')}"""
box = Boxplot(init_opts=opts.InitOpts(width='800px', height='400px', bg_color='white'))
box.add_xaxis(['']).add_yaxis(
    # itemstyle_opts设置颜色,tooltip_opts设置标签的格式和颜色
    '在售', box.prepare_data([is_sale_price.to_list()]), itemstyle_opts=opts.ItemStyleOpts(color='#4863C4'),
    tooltip_opts=opts.TooltipOpts(position='right', background_color='#4863C4',
        formatter=JsCode(content_function), is_always_show_content=True)
).add_yaxis(
    '待售', box.prepare_data([stay_sale_price.to_list()]), itemstyle_opts=opts.ItemStyleOpts(color='#FF9366'),
    tooltip_opts=opts.TooltipOpts(position='right', background_color='#FF9366',
        formatter=JsCode(content_function2), is_always_show_content=True)
).set_global_opts(
    title_opts=opts.TitleOpts(title='在售和待售楼盘价格分布', pos_left='300', pos_top='10',
        title_textstyle_opts=opts.TextStyleOpts(color='black', font_size=16)),
    legend_opts=opts.LegendOpts(pos_right='80', pos_top='50', orient='vertical')
).set_colors(['#4863C4', '#FF9366']).render('is_sale_price_box.html')
 在售楼盘的区域分布
from pyecharts.charts import Map
from pyecharts import options as opts


def location_parse(loc):
    return re.findall(r'\[(.*?)\]', loc)[0] if re.findall(r'\[(.*?)\]', loc) else '未知'


df_new['位置'] = df_new['地址'].apply(location_parse)
# 获取在售楼盘的位置信息
build_location = df_new.loc[df_new['是否在售']=='在售', '位置'].value_counts()
print(build_location)
data_pair = [['南明区', int(build_location['南明'])], ['云岩区', int(build_location['云岩'])],
             ['清镇市', int(build_location['清镇'])], ['白云区', int(build_location['白云'])],
             ['观山湖区', int(build_location['观山湖'])], ['修文县', int(build_location['修文'])],
             ['乌当区', int(build_location['乌当'])], ['花溪区', int(build_location['花溪'])],
             ['开阳县', int(build_location['开阳'])], ['息烽县', int(build_location['息烽'])]]
map = Map(init_opts=opts.InitOpts(bg_color='black', width='1000px', height='700px'))
map.add(
    '', data_pair=data_pair, maptype="贵阳"
).set_global_opts(
    title_opts=opts.TitleOpts(title='贵阳各区在售楼盘分布', pos_left='400', pos_top='50',
                              title_textstyle_opts=opts.TextStyleOpts(color='white', font_size=16)),
    visualmap_opts=opts.VisualMapOpts(max_=40, is_piecewise=True, pos_left='100', pos_bottom='100',
                                      textstyle_opts=opts.TextStyleOpts(color='white', font_size=16))
).render("sale_build_location.html")
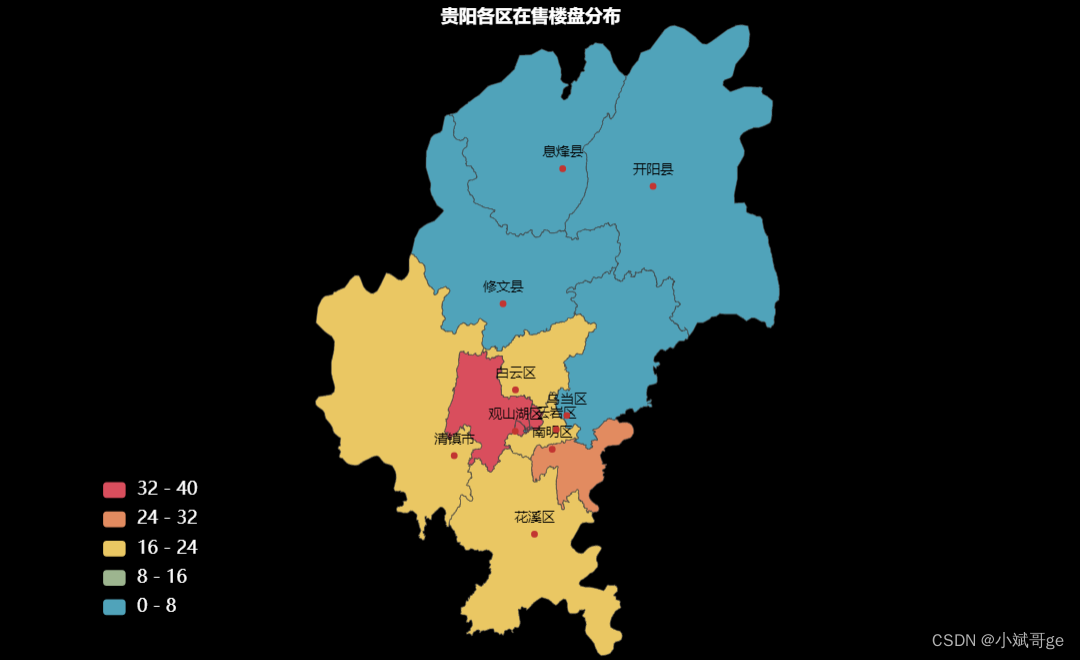 对在售楼盘的位置信息可视化,分布最多的是观山湖区和南明区。
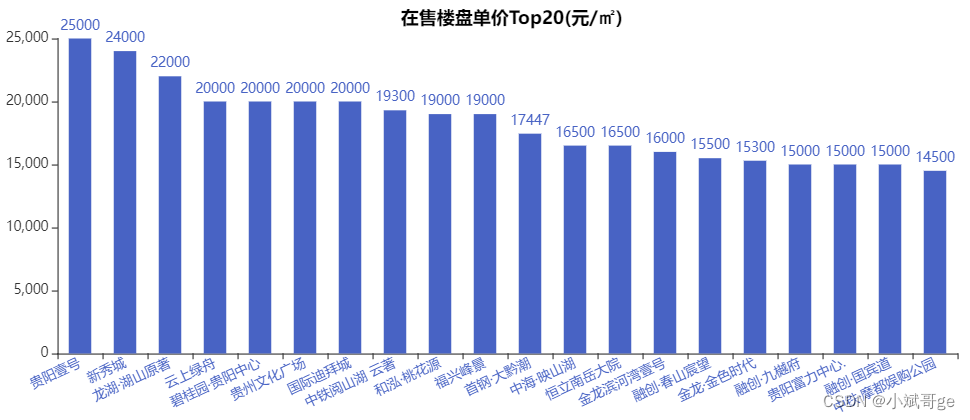
在售单价Top20的楼盘
from pyecharts.charts import Bar
from pyecharts import options as opts

# 获取在售单价前20的楼盘价格和楼盘
df_new['单价'] = df_new['单价'].values.astype(int)
is_sale_price_top20 = df_new.loc[df_new['是否在售']=='在售', '单价'].sort_values(ascending=False)[0:20]
build_name_top20 = df_new.loc[is_sale_price_top20.index, '楼盘']
bar = Bar(init_opts=opts.InitOpts(width='1000px', height='400px', bg_color='white'))
bar.add_xaxis(
    build_name_top20.to_list()
).add_yaxis(
    '', is_sale_price_top20.to_list(), category_gap=20
).set_global_opts(
    title_opts=opts.TitleOpts(title='在售楼盘单价Top20(元/㎡)', pos_left='400', pos_top='30',
        title_textstyle_opts=opts.TextStyleOpts(color='black', font_size=16)),
    xaxis_opts=opts.AxisOpts(axislabel_opts=opts.LabelOpts(font_size=12, rotate=25, color='#4863C4'))
).set_colors('#4863C4').render('is_sale_top20_price.html')
 单价Top20楼盘的区域分布
from pyecharts.charts import Pie
from pyecharts import options as opts


df_new['位置'] = df_new['地址'].apply(location_parse)
df_new['单价'] = df_new['单价'].values.astype(int)
# 获取在售单价前20的楼盘价格和位置
is_sale_price_top20 = df_new.loc[df_new['是否在售']=='在售', '单价'].sort_values(ascending=False)[0:20]
build_location_top20 = df_new.loc[is_sale_price_top20.index, '位置'].value_counts()
pie = Pie(init_opts=opts.InitOpts(width='600px', height='400px', bg_color='white'))
pie.add(
    '', [list(z) for z in zip([gen for gen in build_location_top20.index], build_location_top20)],
    radius=['35%', '60%'], center=['60%', '60%']
).set_series_opts(
    label_opts=opts.LabelOpts(formatter="{b}: {c}"),
).set_global_opts(
    title_opts=opts.TitleOpts(title='在售单价Top20楼盘位置分布', pos_left='250', pos_top='50',
        title_textstyle_opts=opts.TextStyleOpts(color='black', font_size=16)),
    legend_opts=opts.LegendOpts(pos_left='50', pos_top='100', orient='vertical')
).render('build_location_top20.html')
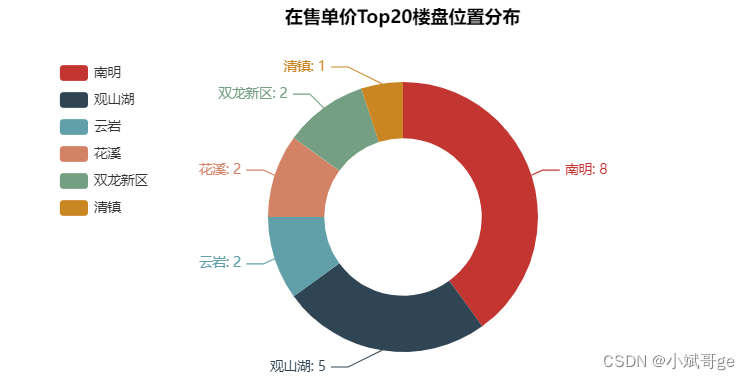
单价前20的楼盘主要分布在南明区和观山湖区,说明这两个区是贵阳的核心区域。
观山湖区楼盘Top20单价
from pyecharts.charts import Bar
from pyecharts import options as opts

# 获取观山湖在售的楼盘
df_new['位置'] = df_new['地址'].apply(location_parse)
is_sale_core = df_new[(df_new['是否在售']=='在售') & (df_new['位置']=='观山湖')]
core_price = is_sale_core.copy()
core_price.loc[:, '单价'] = core_price.loc[:, '单价'].apply(lambda x: int(x))
is_sale_core = core_price.sort_values('单价', ascending=False)[0: 20]
bar = Bar(init_opts=opts.InitOpts(width='1000px', height='400px', bg_color='white'))
bar.add_xaxis(
    is_sale_core['楼盘'].to_list()
).add_yaxis(
    '', is_sale_core['单价'].to_list(), category_gap=20
).set_global_opts(
    title_opts=opts.TitleOpts(title='观山湖区在售楼盘Top20单价(元/㎡)', pos_left='380', pos_top='30',
        title_textstyle_opts=opts.TextStyleOpts(color='black', font_size=16)),
    xaxis_opts=opts.AxisOpts(axislabel_opts=opts.LabelOpts(font_size=11, rotate=25, color='#4863C4'))
).set_colors('#4863C4').render('is_sale_core.html')
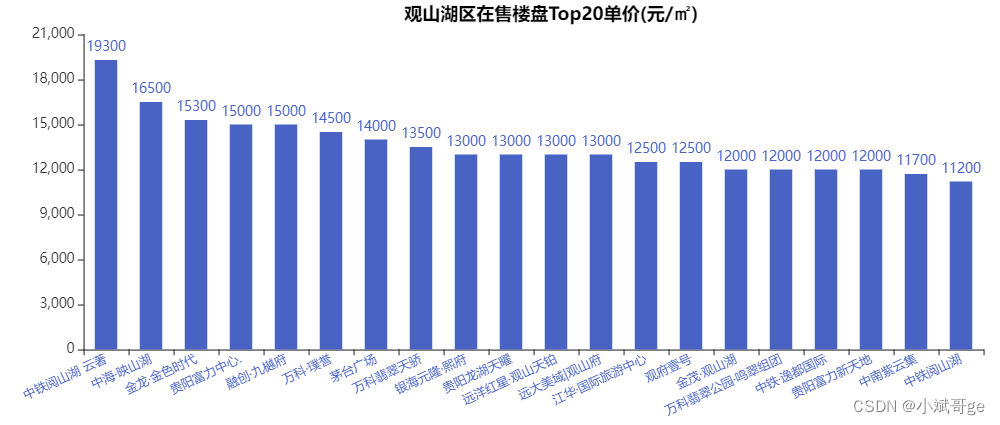 观山湖区在售单价Top20的楼盘单价全部在1W以上。前三名分别是中铁阅山湖云著、中海映山湖和金龙金色时代。
观山湖区楼盘位置
import folium

core_location = pd.read_excel('core_location_lng_lat.xlsx')
map = folium.Map(
    # location设置地图显示的经纬度,初始经纬度选择与位置相近的,zoom_start设置放大倍数
    location=[26.62, 106.61], zoom_start=13, attr='高德-常规图',
    # tiles用于设置不同类型的地图,这里使用高德的常规地图,个人觉得更美观
    tiles='https://wprd01.is.autonavi.com/appmaptile?x={x}&y={y}&z={z}&lang=zh_cn&size=1&scl=1&style=7'
)
# 标注每个楼盘的位置
for index in core_location.index:
    folium.Marker(
        location=[core_location.loc[index, '纬度'], core_location.loc[index, '经度']],  # 经纬度
        popup=core_location.loc[index, '楼盘'],  # 鼠标悬停在标注点时显示的内容
        draggable=True  # draggable设置为True,可以手动移动地图上的标注点,调整误差
    ).add_to(map)
map.save('core_location_map.html')
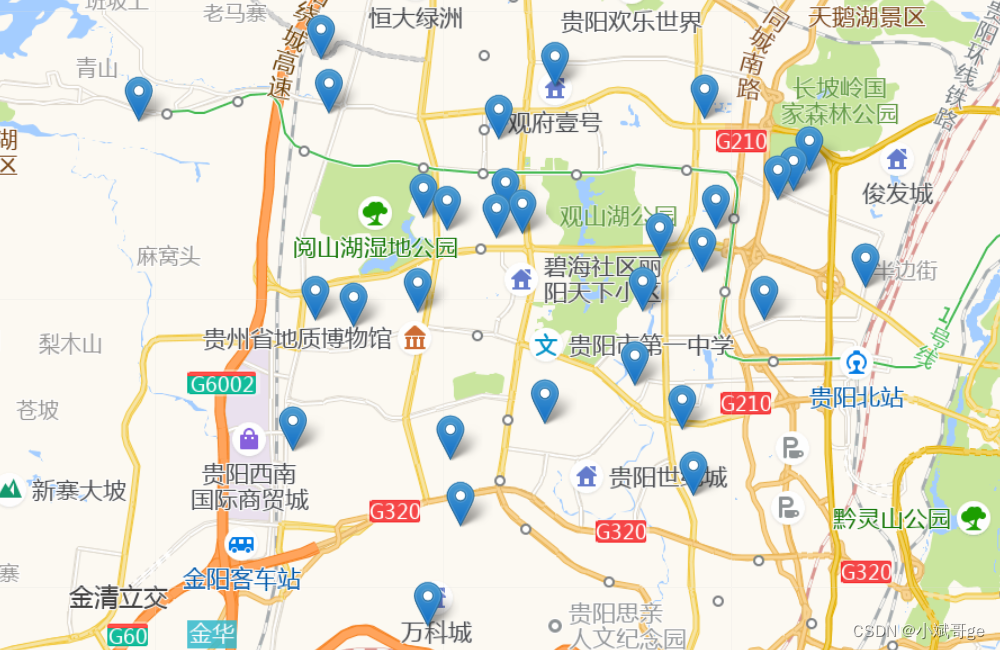 位置标注需要先获取每个楼盘位置的经纬度,本文使用百度地图的API获取经纬度,然后保存到EXCEL文件core_location_lng_lat.xlsx中。具体获取经纬度的步骤和代码可以参考之前的文章:用Python展示全国高校的分布情况
总结
本文获取了房天下上贵阳市的新房数据,清洗数据后,对数据进行了逐层分析,并用Python进行可视化。
一个城市的楼盘数量是有限的,对比安居客(历史文章)和房天下上的数据,大部分楼盘是一样的,房天下的数据包含了部分新区的楼盘信息。
文中用到的Python库和工具以后会专门写文章详细介绍,对代码有疑问可以关注和联系我一起交流讨论,欢迎点赞、评论和收藏。