有评论问,如何在m_map中批量绘制坐标点。

这里简要演示一下。
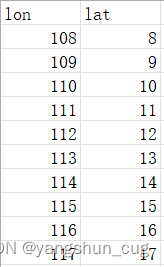
一、经纬度坐标数据
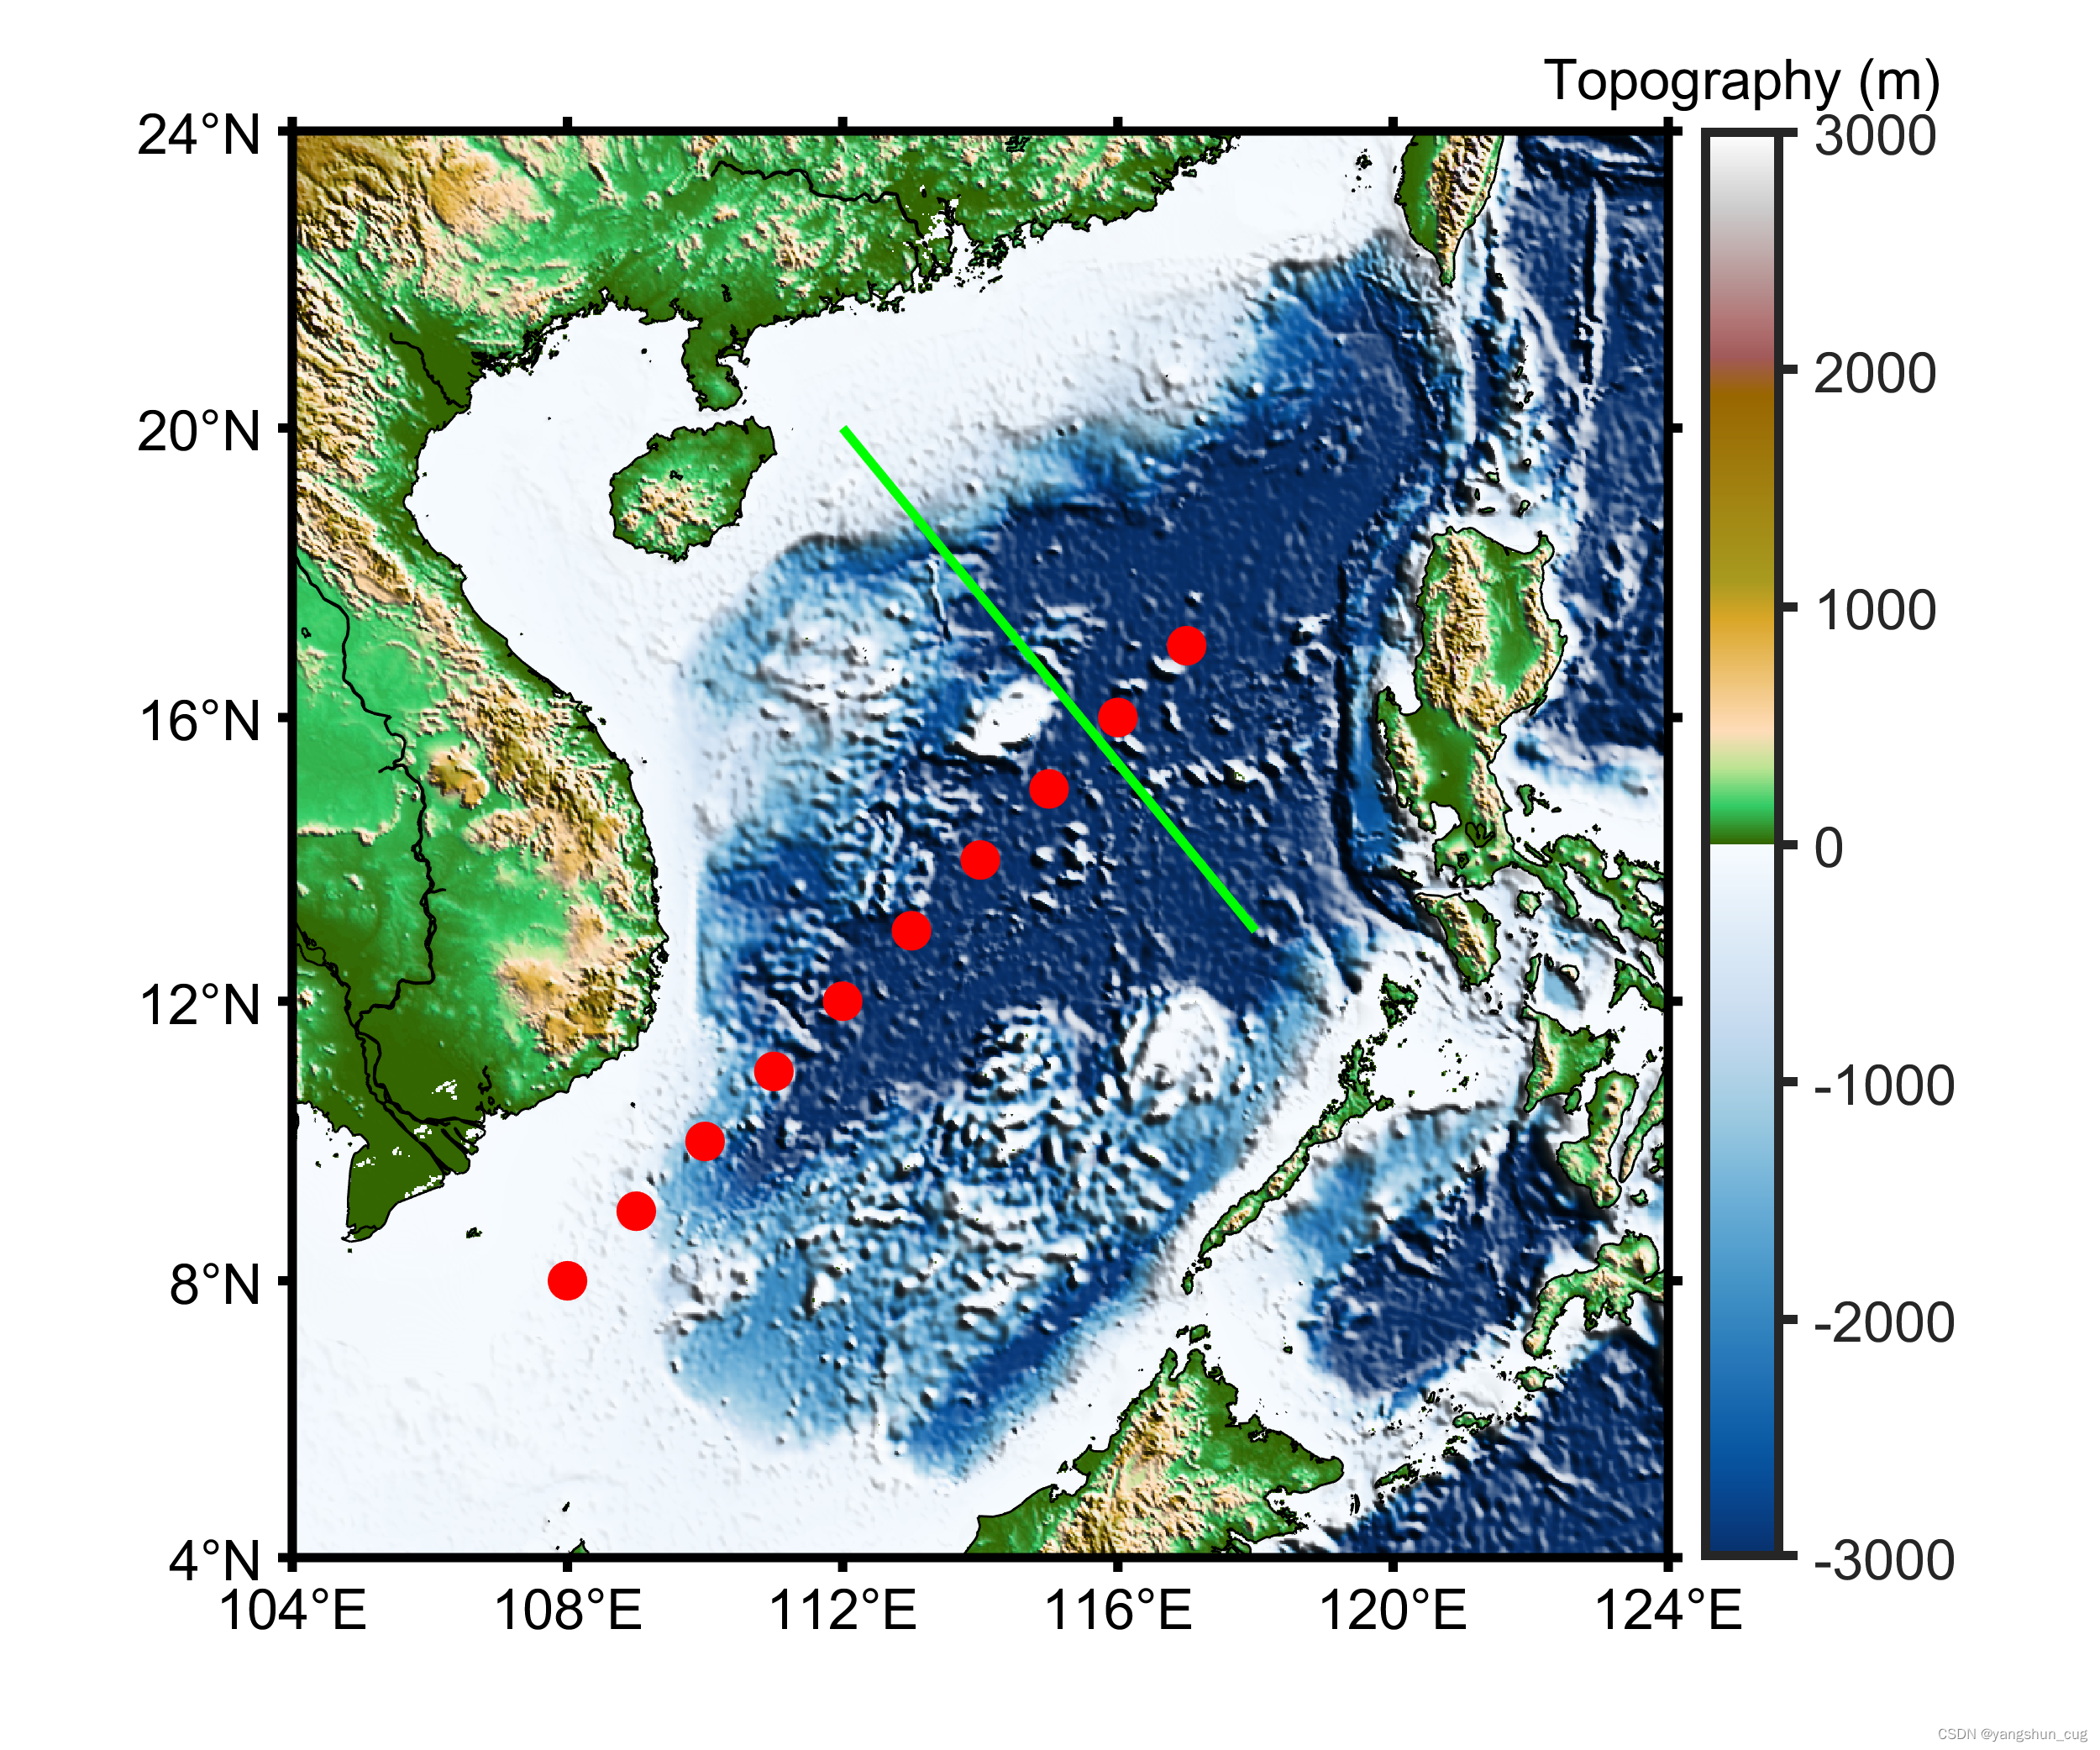
二、成图结果
三、代码
close all
figname='mapplot';

% 读取经纬度坐标
[data]=xlsread('cast_location.xlsx');
Lon=data(:,1);
Lat=data(:,2);

%% 绘制底图
figure
m_proj('mercator','long',[104 124],'lat',[4 24]);

caxis([-3000 3000])
% caxis要放在colormap之前,colormap要放在m_shadedrelief之前
colormap([m_colmap('blue',300);m_colmap('gland',300)])
hc=colorbar('eastoutside','fontsize',12,'linewidth',2);
set(hc,'tickdir','out')
set(get(hc,'title'),'string','Topography (m)')

m_etopo2('shadedrelief','lightangle',45);

m_gshhs('ic','color','k')

%% 绘制坐标点
hold on
% 画点
m_plot(Lon,Lat,'ro','markersize',8,'markerfacecolor','r')
% 画线
m_plot([112 118],[20 13],'g-','linewid',2)

m_grid('box','on','tickdir','out','gridlines','no',...
    'fontsize',12,'xaxislocation','bottom','linewidth',2)

set(gcf,'position',[100 100 600 500])
%% 导出图片
print('-dpng','-r400',[figname,'.png'])