用到的链接:
1、m_map下载:https://www.eoas.ubc.ca/~rich/map.html
2、plot_google_map.m函数下载:https://github.com/xiaogongwei/plot_google_map
3、可视化的GUI MAP-LAB:http://www.dimitriospiretzidis.com/maplab_home.html
% download m_map tools https://www.eoas.ubc.ca/~rich/map.html
% If you decide that M_Map made a significant contribution to a project, and you want acknowledge that contribution with a citation (thanks!), I recommend something like the following:
% Pawlowicz, R., 2019. "M_Map: A mapping package for MATLAB", version 1.4k, [Computer software], available online at www.eoas.ubc.ca/~rich/map.html.
%
clear
clc
close all;
%% 获取投影及其它函数参数
m_proj('get') % 获得默认参数
m_proj('set') % 获得可用的投影
%% 画出底图
figure;
% m_proj('oblique mercator');%确定投影方式和绘图界线
m_proj('oblique mercator', 'longitudes', [-132,-125], 'latitudes', [56, 40], 'aspect', 0.5);
m_coast('patch', [.7 .7 .7])
m_coast('linewidth', 2, 'color', 'r');%画出海岸线
m_grid;%添加格网
%% 指定区域画出点
longtitude = -129;
latitude = 48.5;
%转换坐标后使用matlab自带函数画图
[X,Y]=m_ll2xy(longtitude, latitude);%m_112xy(以及它的逆 m_xy112)的功能是将经纬度坐标转换为它对应的投影坐标(投影坐标转换成经纬度坐标)
line(X,Y,'marker','square','markersize',8,'color','r', 'linewidth', 6);
text(X,Y,' M5','vertical','top');%将M5标在图中
%直接使用m_map 自带函数
longtitude1 = -130;
latitude1 = 51;
m_line(longtitude1,latitude1,'marker','*','markersize',4,'color','r');
m_text(longtitude1,latitude1,' M6','vertical','top');%将M5标在图中
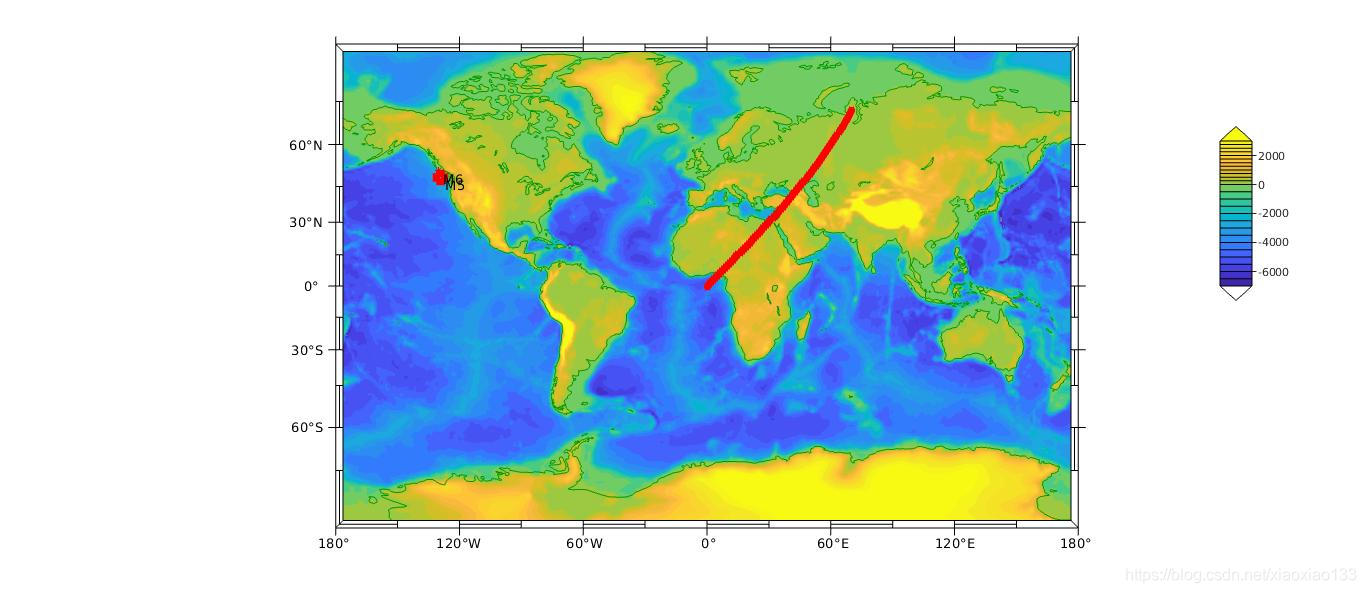
%% 画出全世界地图标志点
figure
lon = 0:1:70;
lat = 0:1:70;
m_proj('miller');
[CS,CH]=m_etopo2('contourf',[-7000:500:0 0:250:3000],'edgecolor','none');
% m_coast('patch',[0.7 0.7 0.7]);
m_coast('color',[0 .6 0]);
m_line(lon,lat, 'marker','*','markersize',4, 'linewidth',3,'color','r');
m_grid('linestyle','none','box','fancy','tickdir','out');
% plot M5 point last
m_line(longtitude,latitude,'marker','square','markersize',8,'color','r', 'linewidth', 6);
m_text(longtitude,latitude,' M5','vertical','top');%将M5标在图中
% plot M6 point last
m_line(longtitude1,latitude1,'marker','*','markersize',4,'color','r');
m_text(longtitude1,latitude1,' M6','vertical','top');%将M5标在图中
ax=m_contfbar(1,[0.5 .8],CS,CH);
title(ax,{'Level/m',''}); % Move up by inserting a blank line
%9. Google Maps Static API
% Axis limits
lms=[ -123-[14 8]/60 49+[10 13.5]/60 ];
% plot_google_maps.m from the mathworks user contributed files database:
% https://www.mathworks.com/matlabcentral/fileexchange/27627-zoharby-plot_google_map
% accesses the static google maps map tiles, returning a lat/long gridded
% image that is just bigger than the given limits.
clf;
axis(lms);
[Glon,Glat,Gimg]=plot_google_map('maptype','satellite','refresh',0,'autoaxis',0);
clf;
% Now draw it!
m_proj('utm','lat',lms(3:4),'lon',lms(1:2));
m_image(Glon,Glat,Gimg);
m_grid('tickdir','out','box','fancy');
m_ruler([.4 .9],1.05,6,'tickdir','in','ticklen',.01);