一、前言
时间序列数据的生成,其实很多工具都已经具备了, 比如sklearn中的make_multilabel_classification
例子:
from sklearn.datasets import make_multilabel_classification


x, y = make_multilabel_classification(n_samples=100, n_features=20, n_classes=5, n_labels=2, random_state=None)

print(x.shape)
print(y.shape)
x的维度: (100, 20)
y的维度: (100, 5)
二、agots
link:https://github.com/KDD-OpenSource/agots
2.1 生成一般的时间序列
import numpy as np
import pandas as pd
import matplotlib.pyplot as plt
from agots.multivariate_generators.multivariate_data_generator import MultivariateDataGenerator

STREAM_LENGTH = 200
N = 4
K = 2

dg = MultivariateDataGenerator(STREAM_LENGTH, N, K)
df = dg.generate_baseline(initial_value_min=-4, initial_value_max=4)

for col in df.columns:
    plt.plot(df[col], label=col)
plt.legend()
plt.show()

df.corr()
生成一个数据大小的初始范围为-4到4之间的时间序列
其中STREAM_LENGTH为数据长度,n为时间序列个数,k为相关性时间序列个数
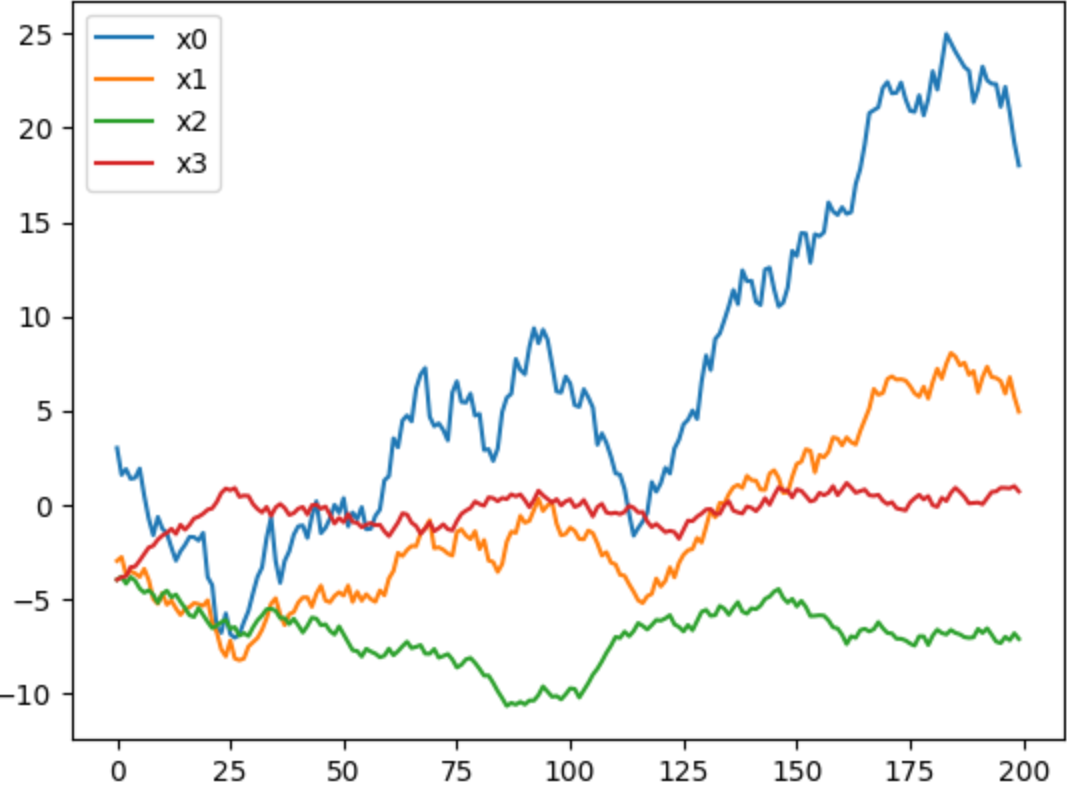
生成四个时间序列,能看到,x0和x1有一定的相关性,线的趋势和走向很相似
通过计算相关性也能证明这一点:

2.2 生成有周期的时间序列
通过设置MultivariateDataGenerator中的behavior,来生成有周期的时间序列
其中behavior可以自定义,周期的基底
import numpy as np


def sine_generator(cycle_duration=np.random.randint(5, 50),
                   phase_shift=np.random.uniform(0, 2*np.pi),
                   amplitude=np.random.uniform(0, 3)):
    phase_angle = 2*np.pi / cycle_duration
    while True:
        value = amplitude * np.sin(phase_shift)
        yield value
        phase_shift = np.around((phase_shift + phase_angle) % (2*np.pi), decimals=15)
生成代码:
STREAM_LENGTH = 200
N = 4
K = 2
behavior_config = {'amplitude': 1}

dg = MultivariateDataGenerator(STREAM_LENGTH, N, K, behavior=sine_generator, behavior_config=behavior_config)
a = dg.generate_baseline(initial_value_min=-4, initial_value_max=4)

for col in a.columns:
    plt.plot(a[col], label=col)
plt.legend()
plt.show()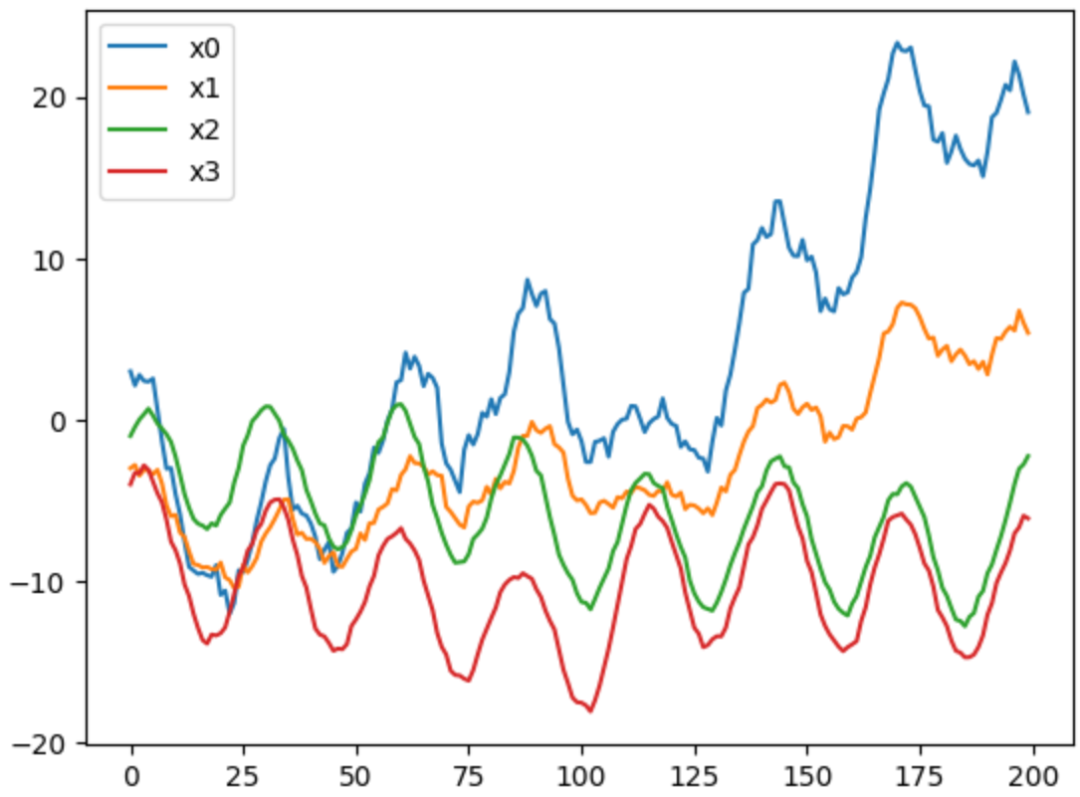
2.3 向时间序列中加入异常
时序异常主要的分类为 突刺、趋势、飘逸、方差,对应每种异常都有一个oulier_generator
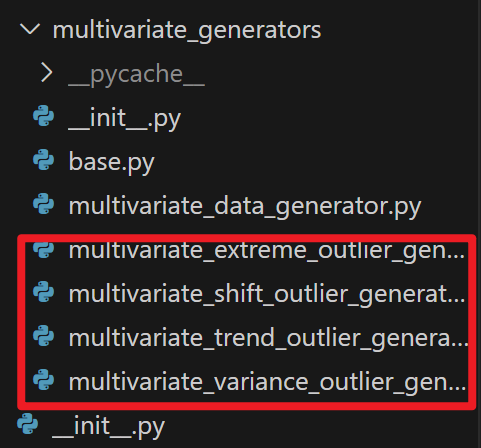
每个异常生成器其实都是继承的MultivariateOutlierGenerator
class MultivariateOutlierGenerator:
    def __init__(self, timestamps):
        self.timestamps = timestamps

    def add_outliers(self, timeseries):
        return NotImplementedError
比如以下的每个时序分别加入四种异常中的一种:
df = dg.add_outliers({'extreme': [{'n': 0, 'timestamps': [(122,)]}],
                      'shift':   [{'n': 1, 'timestamps': [(10,30)]}],
                      'trend':   [{'n': 2, 'timestamps': [(40, 70)]}],
                      'variance':[{'n': 3, 'timestamps': [(50, 100)]}]})

for col in df.columns:
    plt.plot(df[col], label=col)
plt.legend()
plt.show()
add_outliers中格式为异常的类型:列表,列表中为多个字典,每个字典为两部分,n为代表着你想插入该异常是哪条线,其次timestamps代表在该时间序列的哪个时间区间插入该异常,也是一个可以设置为多段落的列表
三、总结
后续的更详细的代码介绍和解析,后面有时间再分享吧
作者代码其实写的比较潦草和冗余,有很多可以优化的地方
其实异常类型的方向也很有关系,这里没有做区分
加入异常的方式比较简单,有很多需要优化的地方
没有形成加入整体异常的pipeline,这里需要自己写一下,对于数据的一个random插入
等等等。。。
推荐阅读:
公众号:AI蜗牛车
保持谦逊、保持自律、保持进步

发送【蜗牛】获取一份《手把手AI项目》(AI蜗牛车著)
发送【1222】获取一份不错的leetcode刷题笔记
发送【AI四大名著】获取四本经典AI电子书