官方文档yyds,博文上有很多没有时效性或是互相抄袭的,缺少没有解决问题的逻辑,这种时候还是去看官方文档,但是博文也可以提供解决问题的思路或者方向。
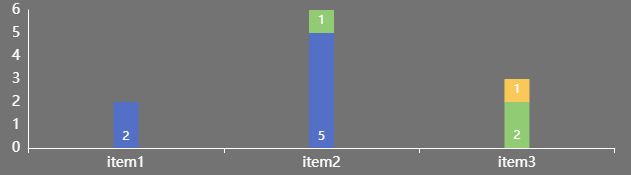
解决后效果:
原来每个item对应的数据有为0的,会挡住其他有数据的bar上的label,这样设置后可以变成这样
formatter的回调函数这样写:
{


	type: 'bar',
    stack: 'class',
    barWidth: 20,
    label: {


    	show: true,
    	position: 'insideBottom',
    	formatter: function(params) {


	 		const a = params.value[params.encode.y[0]]
    		if (a > 0) {


				return a
			} else {


				return ''
			}
		}
	}
}
以下为参照的官方文档部分:
注:encode 和 dimensionNames 的使用方式,例如:
如果数据为:
dataset: {


    source: [
        ['Matcha Latte', 43.3, 85.8, 93.7],
        ['Milk Tea', 83.1, 73.4, 55.1],
        ['Cheese Cocoa', 86.4, 65.2, 82.5],
        ['Walnut Brownie', 72.4, 53.9, 39.1]
    ]
}
则可这样得到 y 轴对应的 value:
params.value[params.encode.y[0]]
如果数据为:
dataset: {


    dimensions: ['product', '2015', '2016', '2017'],
    source: [
        {

    product: 'Matcha Latte', '2015': 43.3, '2016': 85.8, '2017': 93.7},
        {

    product: 'Milk Tea', '2015': 83.1, '2016': 73.4, '2017': 55.1},
        {

    product: 'Cheese Cocoa', '2015': 86.4, '2016': 65.2, '2017': 82.5},
        {

    product: 'Walnut Brownie', '2015': 72.4, '2016': 53.9, '2017': 39.1}
    ]
}
则可这样得到 y 轴对应的 value:
params.value[params.dimensionNames[params.encode.y[0]]]
附上官方文档链接:https://echarts.apache.org/zh/option.html#series-bar.label.formatter