1、目标效果
源码在下方,复制并npm install echarts 便可运行
将echarts封装成子组件,传入对应的option即可展示数据报表!
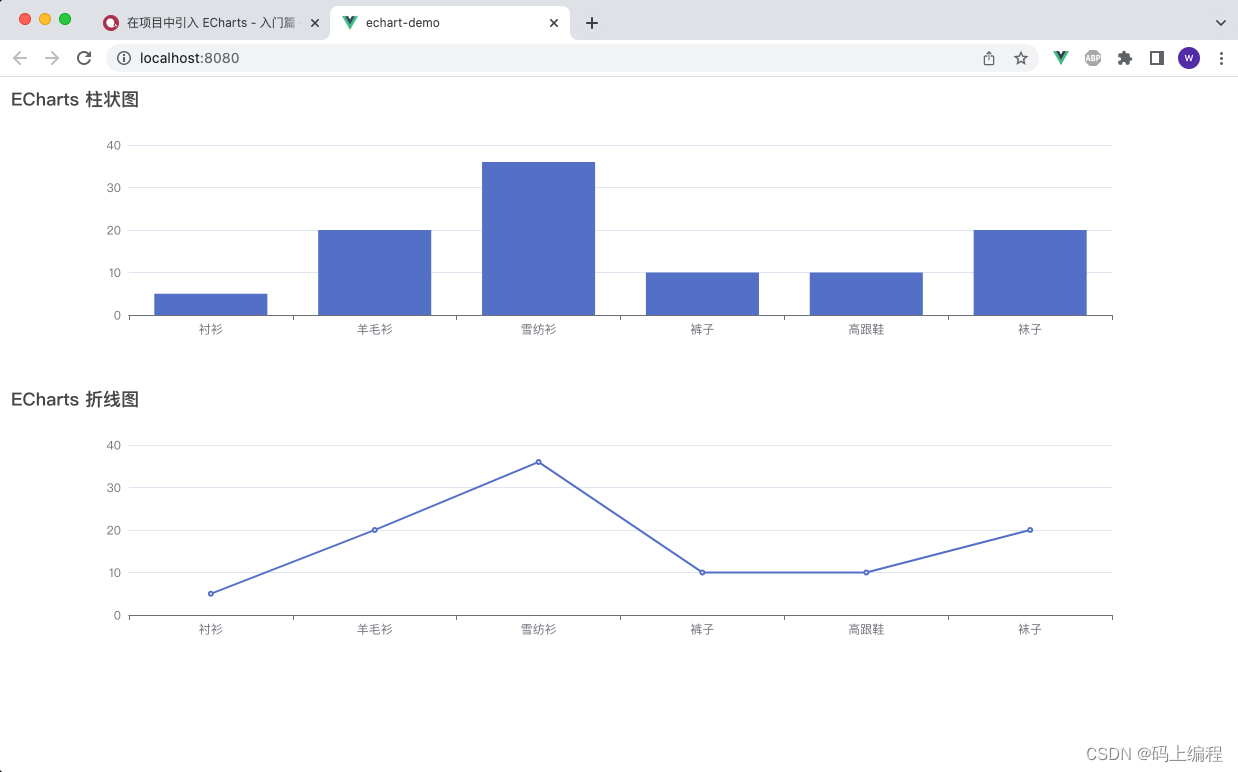
随着窗口大小变化而改变数据报表大小!
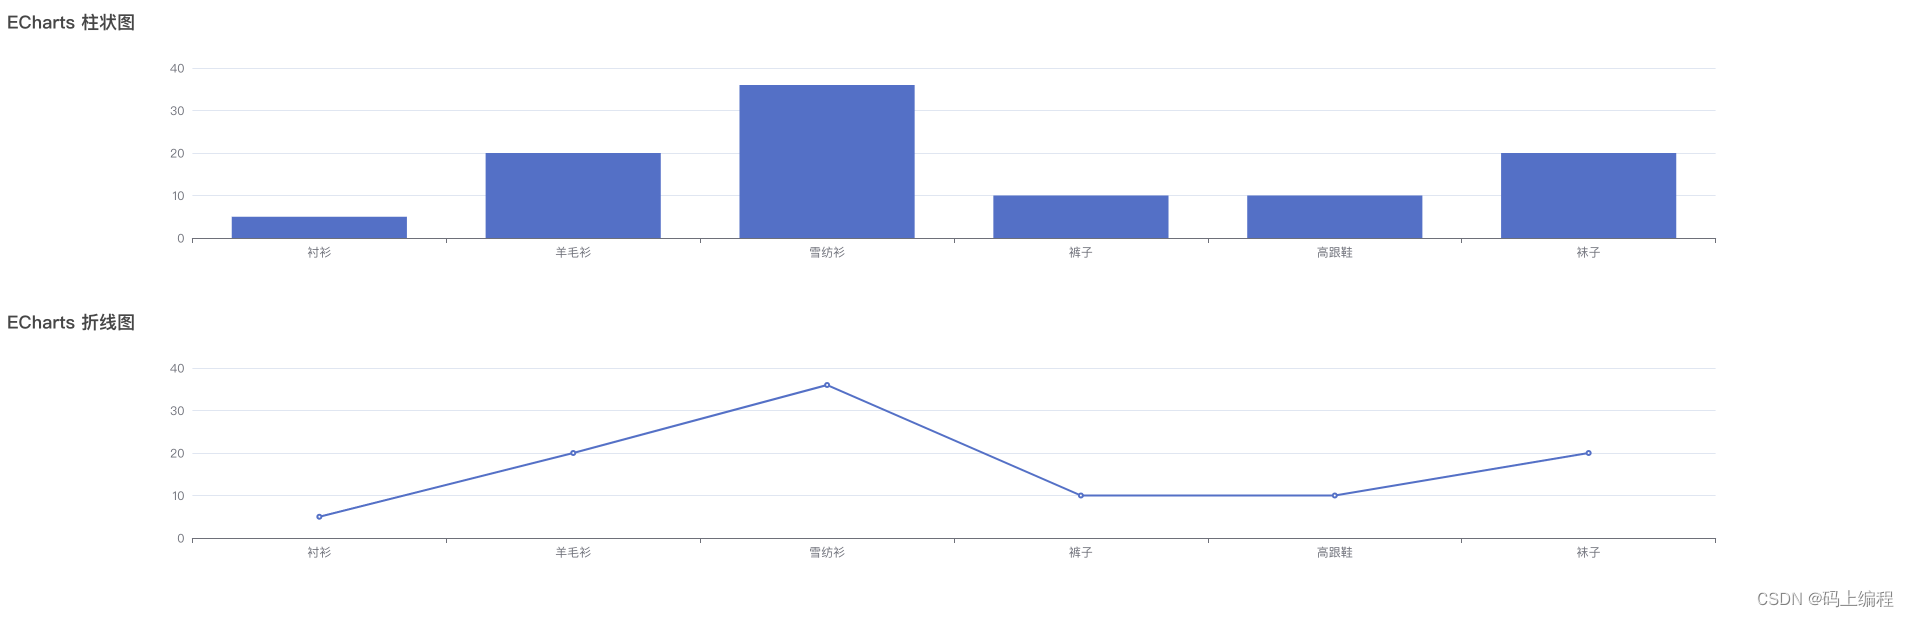
全屏

缩小窗口情况下
2、封装echarts子组件
echarts使用三部曲:
(1)容器实例: echart.init(document.getElementById(this.id));
(2)容器宽高
(3)option配置 echart.setOption()
因此这三个就可以是父组件传给子组件的值,
 props: {
        id: {
            type: String,
            default: ''
        },
        options: {
            type: Object,
            default: {}
        },
        height: {
            type: Number,
            default: 300
        }
    },
在mounted中创建实例
mounted() {
 // 创建echarts实例并设置配置
 this.echarts = echart.init(document.getElementById(this.id));
 this.echarts.setOption(this.options);
}
在beforeDestroy中销毁实例
    beforeDestroy() {
        // 销毁echarts实例
        this.echarts = null
    },
3、多个echarts子组件随窗口变化而变化
(1)窗口大小变化触发事件
window.addEventListener('resize', () => {
     // 调用子组件resetEcharts()
})
(2)echarts自身携带resize()实现自适应窗口大小变化
子组件
import * as echart from 'echarts';
export default {
    methods: {
        // 重置echarts
        resetEcharts() {
            echart.init(document.getElementById(this.id)).resize();
        }
    }
}
4、源码
/components/Echarts.vue
<template>
    <div :id="id" :style="{ 'height': height + 'px' }"></div>
</template>

<script>
import * as echart from 'echarts';
export default {
    props: {
        id: {
            type: String,
            default: ''
        },
        options: {
            type: Object,
            default: {}
        },
        height: {
            type: Number,
            default: 300
        }
    },
    data() {
        return {
            echarts: null
        }
    },
    mounted() {
        // 创建echarts实例并设置配置
        this.echarts = echart.init(document.getElementById(this.id));
        this.echarts.setOption(this.options);
    },
    beforeDestroy() {
        // 销毁echarts实例
        this.echarts = null
    },
    methods: {
        // 重置echarts
        resetEcharts() {
            echart.init(document.getElementById(this.id)).resize();
        }
    }
}
</script>

<style scoped></style>
App.vue
<template>
  <div id="app">
    <!-- 柱状图 -->
    <div>
      <Echarts id="bar" :options="barOptiton" ref="barEchart"></Echarts>
    </div>
    <!-- 折线图 -->
    <div>
      <Echarts id="line" :options="lineOption" ref="lineEchart"></Echarts>
    </div>
  </div>
</template>

<script>
import Echarts from '@/components/Echarts'
export default {
  name: 'App',
  components: {
    Echarts
  },
  data() {
    return {
      lineOption: {
        title: {
          text: 'ECharts 折线图'
        },
        tooltip: {},
        xAxis: {
          data: ['衬衫', '羊毛衫', '雪纺衫', '裤子', '高跟鞋', '袜子']
        },
        yAxis: {},
        series: [
          {
            name: '销量',
            type: 'line',
            data: [5, 20, 36, 10, 10, 20]
          }
        ]
      },
      barOptiton: {
        title: {
          text: 'ECharts 柱状图'
        },
        tooltip: {},
        xAxis: {
          data: ['衬衫', '羊毛衫', '雪纺衫', '裤子', '高跟鞋', '袜子']
        },
        yAxis: {},
        series: [
          {
            name: '销量',
            type: 'bar',
            data: [5, 20, 36, 10, 10, 20]
          }
        ]
      }
    }
  },
  mounted() {
    // 随窗口大小变化
    window.addEventListener('resize', () => {
      this.$refs.barEchart.resetEcharts()
      this.$refs.lineEchart.resetEcharts()
    })
  }
}
</script>

<style>
#app {
  font-family: Avenir, Helvetica, Arial, sans-serif;
  -webkit-font-smoothing: antialiased;
  -moz-osx-font-smoothing: grayscale;
  text-align: center;
  color: #2c3e50;
}
</style>