%matplotlib inline
import matplotlib.pyplot as plt
import numpy as np
n_dots = 200
X = np.linspace(-2 * np.pi, 2 * np.pi, n_dots)
Y = np.sin(X) + 0.2 * np.random.rand(n_dots) - 0.1
X = X.reshape(-1, 1)
Y = Y.reshape(-1, 1)
使用sklearn.preprocessing.PolynomialFeatures来进行特征的构造。
它是使用多项式的方法来进行的,如果有a,b两个特征,那么它的2次多项式为(1,a,b,a^2,ab, b^2)。
PolynomialFeatures有三个参数
degree:控制多项式的度
interaction_only: 默认为False,如果指定为True,那么就不会有特征自己和自己结合的项,上面的二次项中没有a^2和b^2。
include_bias:默认为True。如果为True的话,那么就会有上面的 1那一项。
from sklearn.linear_model import LinearRegression
from sklearn.preprocessing import PolynomialFeatures
from sklearn.pipeline import Pipeline

def polynomial_model(degree=1):
    polynomial_features = PolynomialFeatures(degree=degree,
                                             include_bias=False)
    linear_regression = LinearRegression(normalize=True)  #normalize=True对数据归一化处理
    pipeline = Pipeline([("polynomial_features", polynomial_features),#添加多项式特征
                         ("linear_regression", linear_regression)])
    return pipeline
Pipeline按顺序构建一系列转换和一个模型,最后的一步是模型。Pipeline中间的步骤必须是转换过程,它们必须包含fit和transform方法。最后一步模型只要有fit方法。
Pipeline的目的是能组合好几个步骤,当设置不同参数的时候,可以在一起做交叉验证。可以通过【pipeline的名称+ “__” + 参数名称】(注意是两个下划线)的方式设置多个步骤的参数。
from sklearn.metrics import mean_squared_error
degrees = [2, 3, 5, 10]
results = []
for d in degrees:
model = polynomial_model(degree=d)
model.fit(X, Y)
train_score = model.score(X, Y) #训练集上拟合的怎么样
mse = mean_squared_error(Y, model.predict(X)) #均方误差 cost
results.append({"model": model, "degree": d, "score": train_score, "mse": mse})
for r in results:
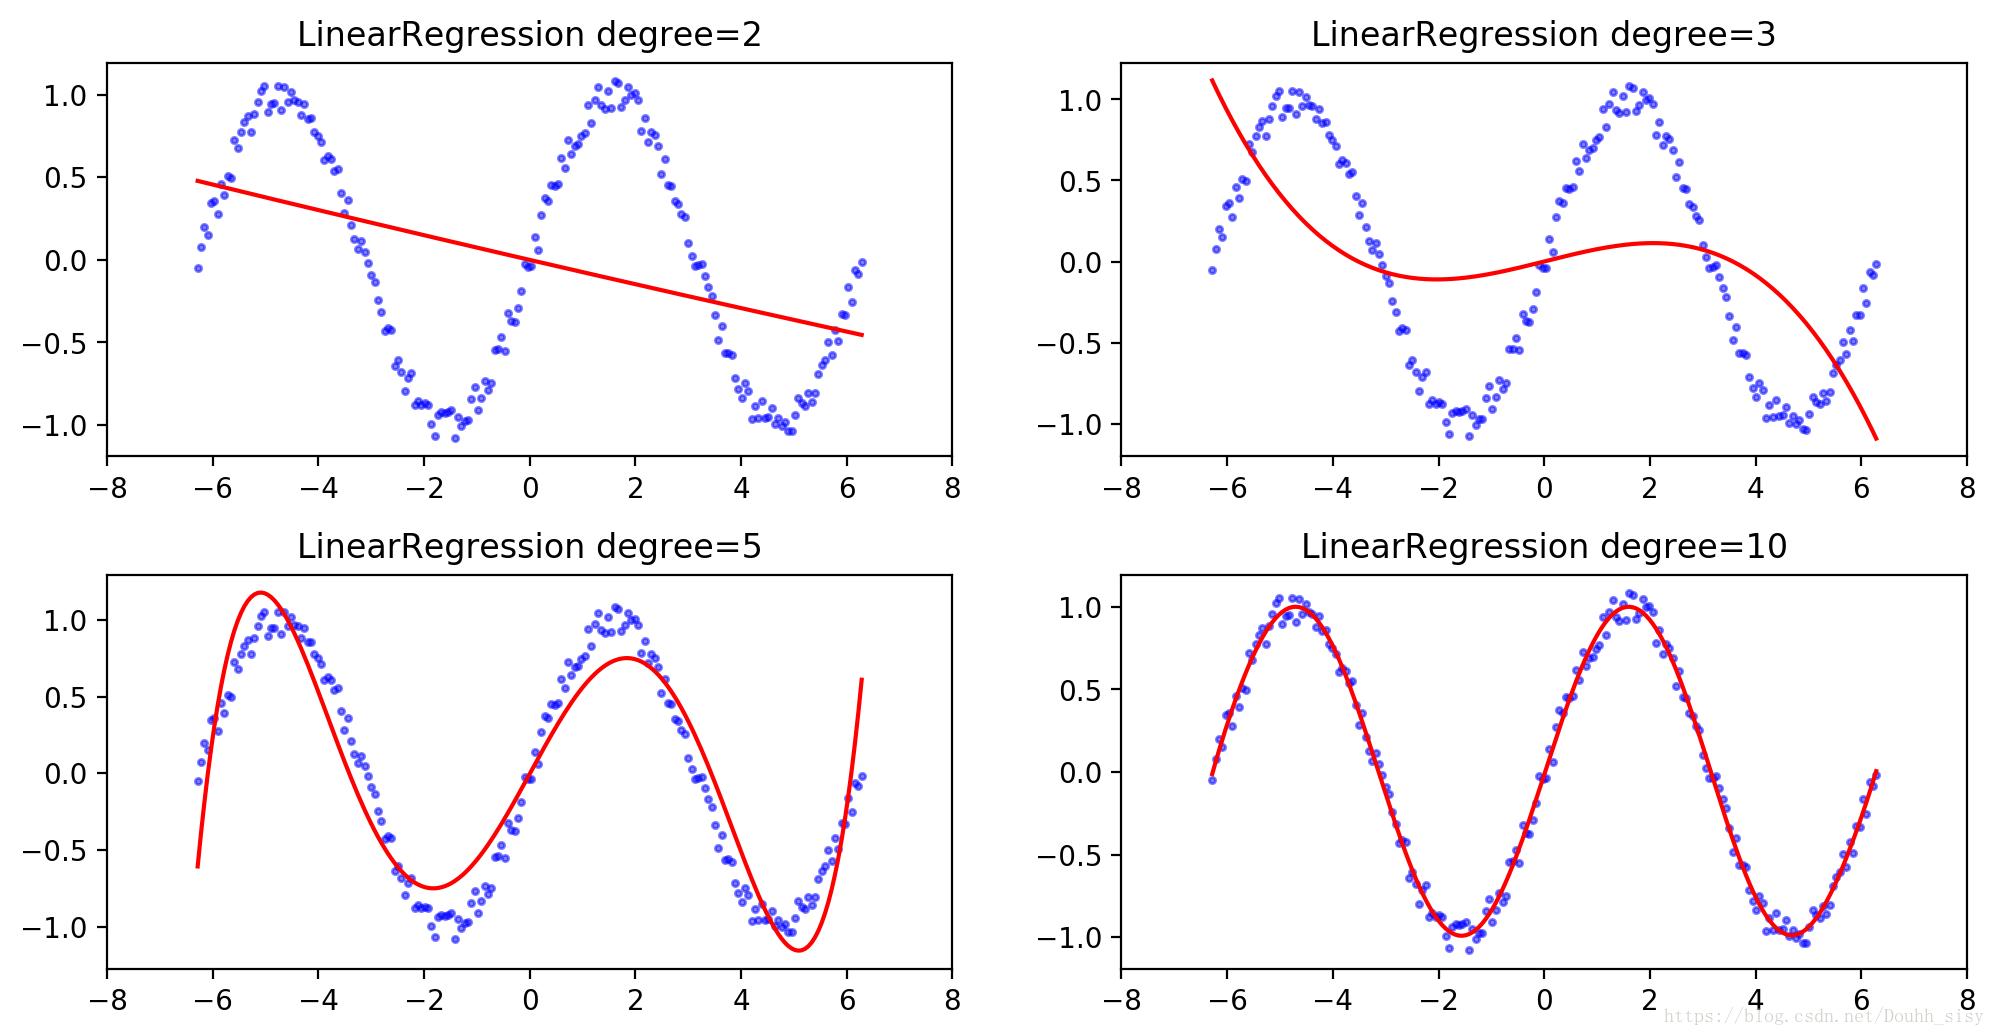
print("degree: {}; train score: {}; mean squared error: {}".format(r["degree"], r["score"], r["mse"]))degree: 2; train score: 0.1586828874804821; mean squared error: 0.41658729121203053
degree: 3; train score: 0.28007573391944973; mean squared error: 0.356478306956282
degree: 5; train score: 0.8956509533414316; mean squared error: 0.05166956197749072
degree: 10; train score: 0.9932749829582538; mean squared error: 0.0033299651119490814
多项式阶数越高,在训练集上拟合的越好
from matplotlib.figure import SubplotParams

plt.figure(figsize=(12, 6), dpi=200, subplotpars=SubplotParams(hspace=0.3))
for i, r in enumerate(results):
    fig = plt.subplot(2, 2, i+1)
    plt.xlim(-8, 8)
    plt.title("LinearRegression degree={}".format(r["degree"]))
    plt.scatter(X, Y, s=5, c='b', alpha=0.5)
    plt.plot(X, r["model"].predict(X), 'r-')