要求
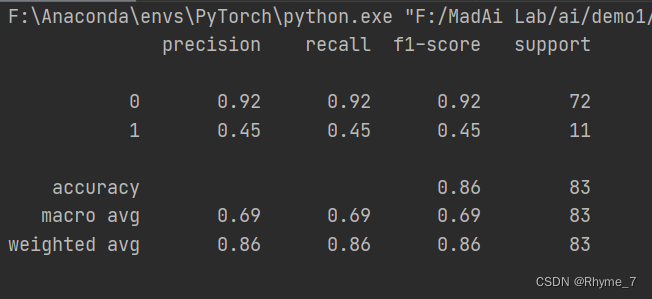
把数据集分为训练集和测试集使用逻辑回归训练、预测,得出相应的分类指标准确率accuracy,精确率precision,召回率recall,F1-score,并画出最终的ROC曲线,得出AUC值。
数据格式
664条样本 每条103个属性,最后一列为标签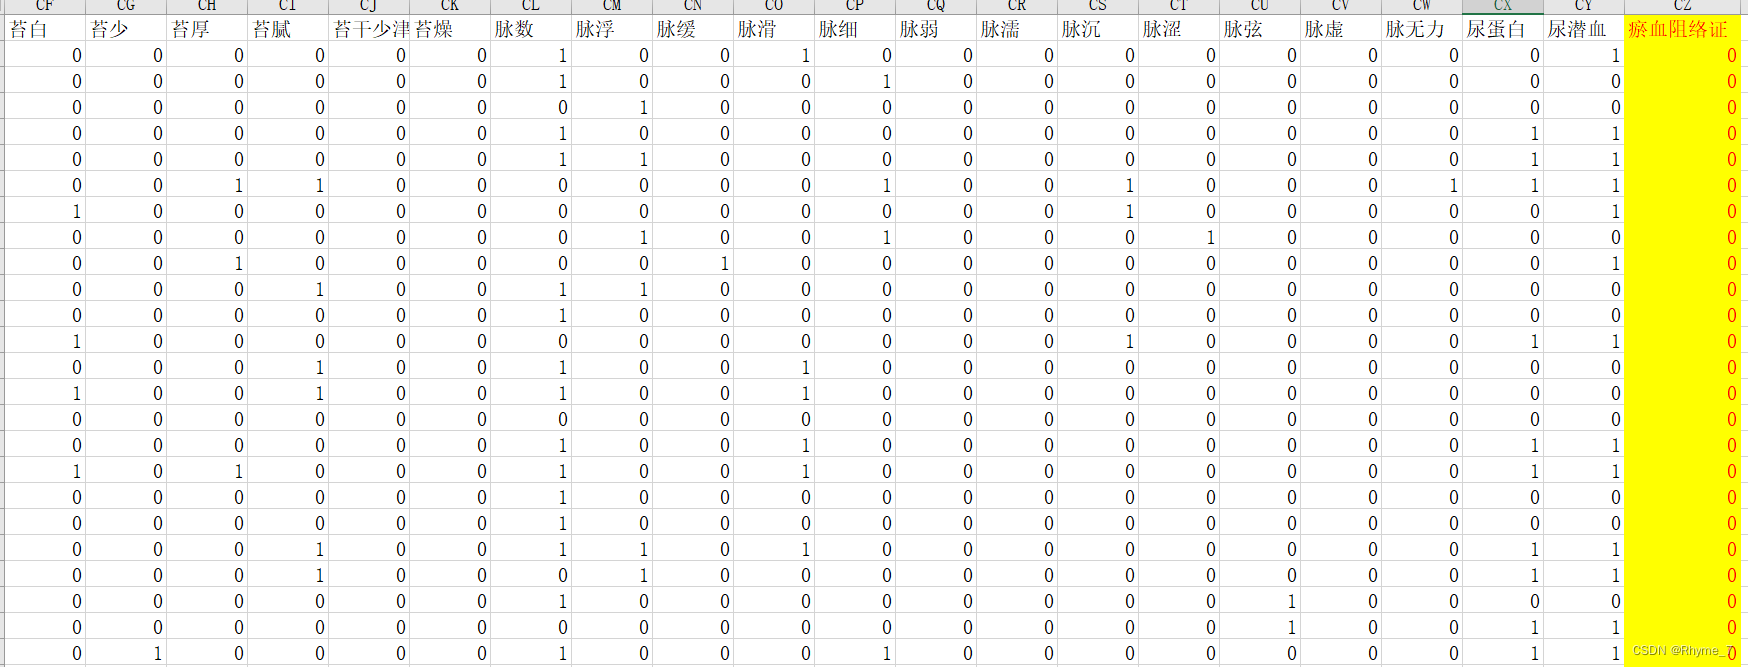
结果

代码
import pandas as pd
from sklearn.linear_model import LogisticRegression
from sklearn.model_selection import train_test_split
from sklearn.preprocessing import StandardScaler
from sklearn.metrics import classification_report, roc_curve, auc
import matplotlib.pyplot as plt

#根据标签和预测概率结果画出ROC图,并计算AUC值
def acu_curve(y, prob):
    fpr, tpr, threshold = roc_curve(y, prob)  ###计算真正率和假正率
    roc_auc = auc(fpr, tpr)  ###计算auc的值
    plt.figure()
    lw = 2
    plt.figure(figsize=(6, 6))
    plt.plot(fpr, tpr, color='darkorange',
             lw=lw, label='ROC curve (area = %0.3f)' % roc_auc)  ###假正率为横坐标,真正率为纵坐标做曲线
    plt.plot([0, 1], [0, 1], color='navy', lw=lw, linestyle='--')
    plt.xlim([0.0, 1.0])
    plt.ylim([0.0, 1.05])
    plt.xlabel('False Positive Rate')
    plt.ylabel('True Positive Rate')
    plt.title('Receiver operating characteristic')
    plt.legend(loc="lower right")
    plt.show()


# 二分类,逻辑回归 瘀血阻络证预测

# 读取数据  (如果不指定标签名,会默认把第一行数据当成标签名)
data = pd.read_excel(
    "症状_瘀血阻络证_data.xlsx"
)
# print(data)

# 缺失值进行处理  (原始数据中的?表示缺失值)  本样本无缺失值
# data = data.replace(to_replace='?', value=np.nan)
# data = data.dropna()  # 删除有缺少值的行

# 分割数据集 划分为训练集和测试集
x_train, x_test, y_train, y_test = train_test_split(data.iloc[:, 0:103], data.iloc[:, 103:104],
                                                    test_size=0.125)  # 前103为属性;最后一列是目标值
# 7:1划分;83条测试、581条训练
# 进行标准化处理   因为目标结果经过sigmoid函数转换成了[0,1]之间的概率,所以目标值不需要进行标准化。
std = StandardScaler()
x_train = std.fit_transform(x_train)
x_test = std.transform(x_test)

# 逻辑回归预测
lg = LogisticRegression(C=1.0)  # 默认使用L2正则化避免过拟合,C=1.0表示正则力度(超参数,可以调参调优)
lg.fit(x_train, y_train.values.ravel())

# 回归系数
# print(lg.coef_)

# 进行预测
y_predict_p = lg.predict_proba(x_test)#结果用类别概率表示 方便画ROC图
#print(y_predict_p)
y_predict = lg.predict(x_test)#结果用标签值表示 方便利用classification_report()函数 输出模型评估报告
#print(y_predict)

# 用classification_report()函数 输出模型评估报告
# 原始数据中的目标值:0表示非瘀血阻络证,1表示瘀血阻络证
print(classification_report(y_test,y_predict))

#调用函数画出ROC图,并计算AUC值
acu_curve(y_test,y_predict_p[:,1:2])
使用五折交叉验证
结果展示

更新一下
import pandas as pd
import warnings
from sklearn.metrics import roc_curve
from sklearn.preprocessing import StandardScaler
from sklearn.model_selection import cross_val_predict
from sklearn.linear_model import LogisticRegression
from sklearn.model_selection import cross_val_score
import matplotlib.pyplot as plt

# 二分类  五折验证  逻辑回归 瘀血阻络证预测

# 读取数据
data = pd.read_excel(
    "症状_瘀血阻络证_data.xlsx"
)
# print(data)

x_train = data.iloc[:, :-1]  # 特征
y_train = data.iloc[:, -1]  # 标签
# 进行标准化处理   因为目标结果经过sigmoid函数转换成了[0,1]之间的概率,所以目标值不需要进行标准化。
std = StandardScaler()
x_train = std.fit_transform(x_train)

lr = LogisticRegression(random_state=填入你的随机数, tol=1e-6, C=0.01)
lr_result = lr.fit(x_train, y_train.ravel())
'''estimator:估计方法对象(分类器)
X:数据特征(Features)
y:数据标签(Labels)
cv:几折交叉验证
scoring='accuracy':准确率为结果的度量指标'''


def muti_score(model):
    warnings.filterwarnings('ignore')
    accuracy = cross_val_score(model, x_train, y_train, scoring='accuracy', cv=5)
    precision = cross_val_score(model, x_train, y_train, scoring='precision', cv=5)
    recall = cross_val_score(model, x_train, y_train, scoring='recall', cv=5)
    f1_score = cross_val_score(model, x_train, y_train, scoring='f1', cv=5)
    auc = cross_val_score(model, x_train, y_train, scoring='roc_auc', cv=5)
    print("准确率:", accuracy.mean())
    print("精确率:", precision.mean())
    print("召回率:", recall.mean())
    print("F1_score:", f1_score.mean())
    print("AUC:", auc.mean())
    #画ROC
    y_scores = cross_val_predict(lr, x_train, y_train, cv=5, method='decision_function')
    fpr, tpr, thresholds = roc_curve(y_train, y_scores)
    plt.plot(fpr, tpr, linewidth=2, label='ROC(AUC=%0.3f)' % cross_val_score(lr, x_train, y_train, cv=5, scoring='roc_auc').mean(),
             color='darkorange')
    plt.xlabel('FPR')  # False Positive Rate,假阳性率
    plt.ylabel('TPR')  # True Positive Rate,真阳性率
    plt.plot([0, 1], [0, 1], color='navy', lw=2, linestyle='--')
    plt.ylim(0, 1.05)
    plt.xlim(0, 1.05)
    plt.legend(loc=4)
    plt.show()


model = eval("lr")
muti_score(model)
注意点
1、iloc函数使用方法(1条消息) iloc函数使用方法_阿狸狸_Nicole的博客-CSDN博客_.iloc![]() https://blog.csdn.net/qq_39368111/article/details/110435536
https://blog.csdn.net/qq_39368111/article/details/110435536
2、 y_train.values.ravel()(1条消息) DataConversionWarning: A column-vector y was passed when a 1d array was expected. 问题解决_weixin_39223665的博客-CSDN博客![]() https://blog.csdn.net/weixin_39223665/article/details/812687413、classification_report()(1条消息) python机器学习classification_report()函数 输出模型评估报告_侯小啾的博客-CSDN博客_classification_report函数
https://blog.csdn.net/weixin_39223665/article/details/812687413、classification_report()(1条消息) python机器学习classification_report()函数 输出模型评估报告_侯小啾的博客-CSDN博客_classification_report函数![]() https://blog.csdn.net/weixin_48964486/article/details/122881350
https://blog.csdn.net/weixin_48964486/article/details/122881350
扫描二维码关注公众号,回复:
15108504 查看本文章
