前言
Home Assistant 中,传感器实体对象 sensor 可以获取对象的信息,比如:自定义的光线传感器、人体传感器等。
这其中,有一个特殊的传感器:Command Line Sensor(命令行传感器),使用它,可以激活Python、Shell等脚本,进而通过脚本获取数据。
比如:本文就通过Shell和Python脚本,获取树莓派的CPU温度、CPU使用率、存储使用情况和内存使用情况:
本文参考:https://bbs.hassbian.com/thread-8475-1-1.html
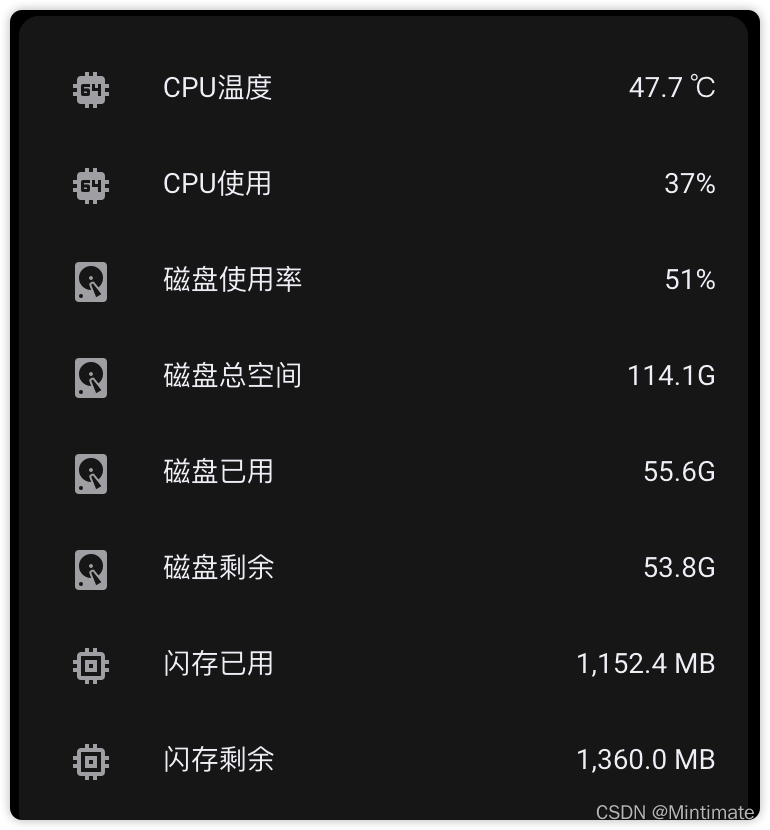
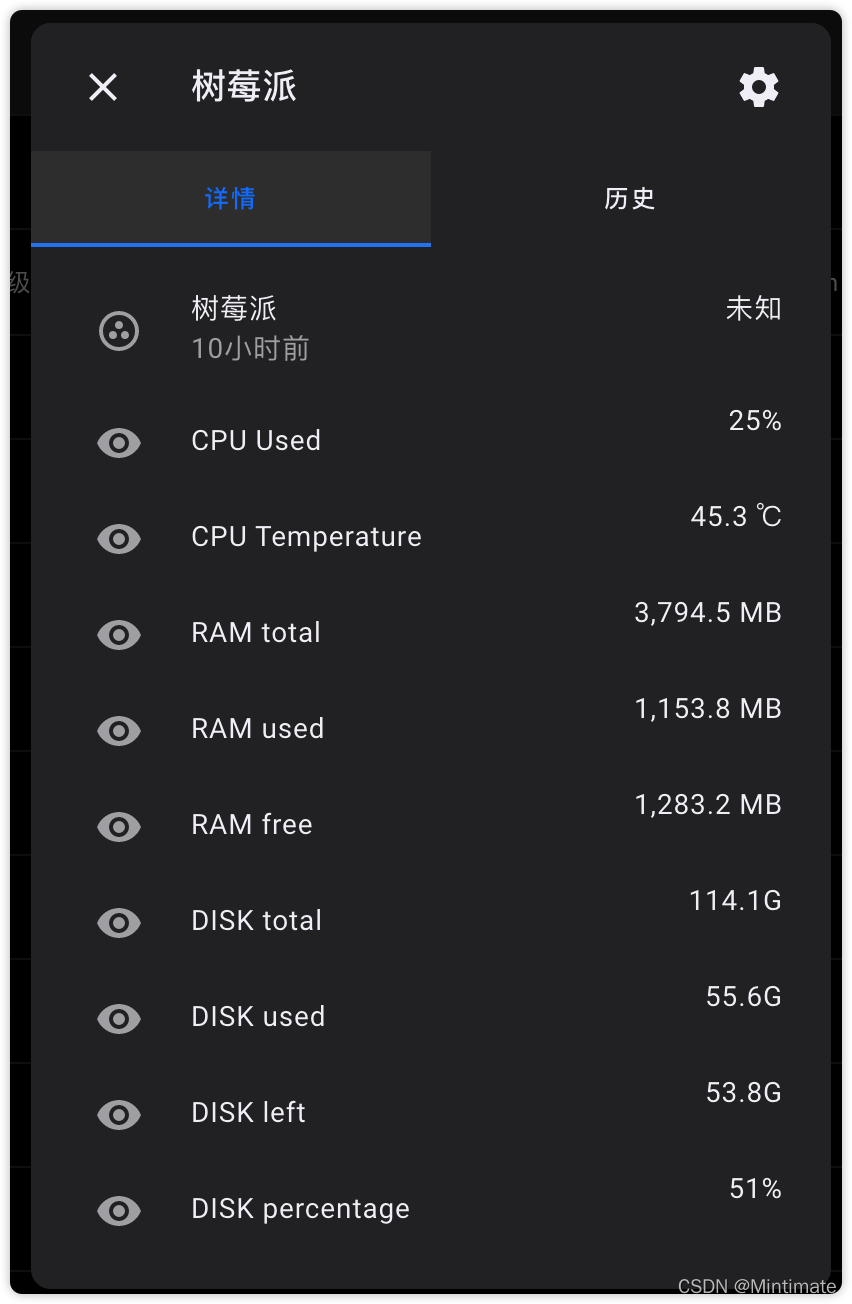
配合第三方前端卡片插件,可以达到效果:
前提
使用的前提很简单,我们需要一台安装了Home Assistant的树莓派,如果你的树莓派并没有安装Home Assistant Core或者Supervised,可以参考教程:
如果树莓派安装的是System版本,理论上也可以使用本教程。
Shell获取信息
首先,我们要知道,如何使用Shell获取树莓派的信息呢?很简单,简单的cat、free和df、top命令即可完成。
CPU温度
如果我们需要获取CPU的温度,可以在临时分区缓存文件内获取:
# 获取树莓派温度
cat /sys/class/thermal/thermal_zone0/temp
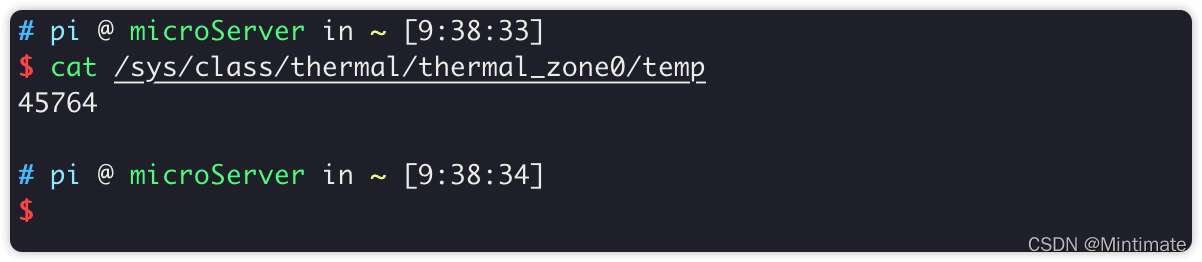
这里的温度,需要除以1000才是真实的摄氏度温度;所以,我这里的CPU温度就是45.764摄氏度。
CPU使用率
CPU使用有点麻烦,最终的命令是:
top -n1 | awk '/Cpu\(s\):/ {print $2}'
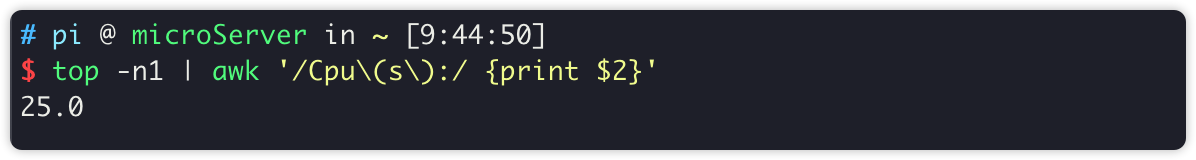
我们一一拆解,首先是top命令,这个是获取系统信息的:
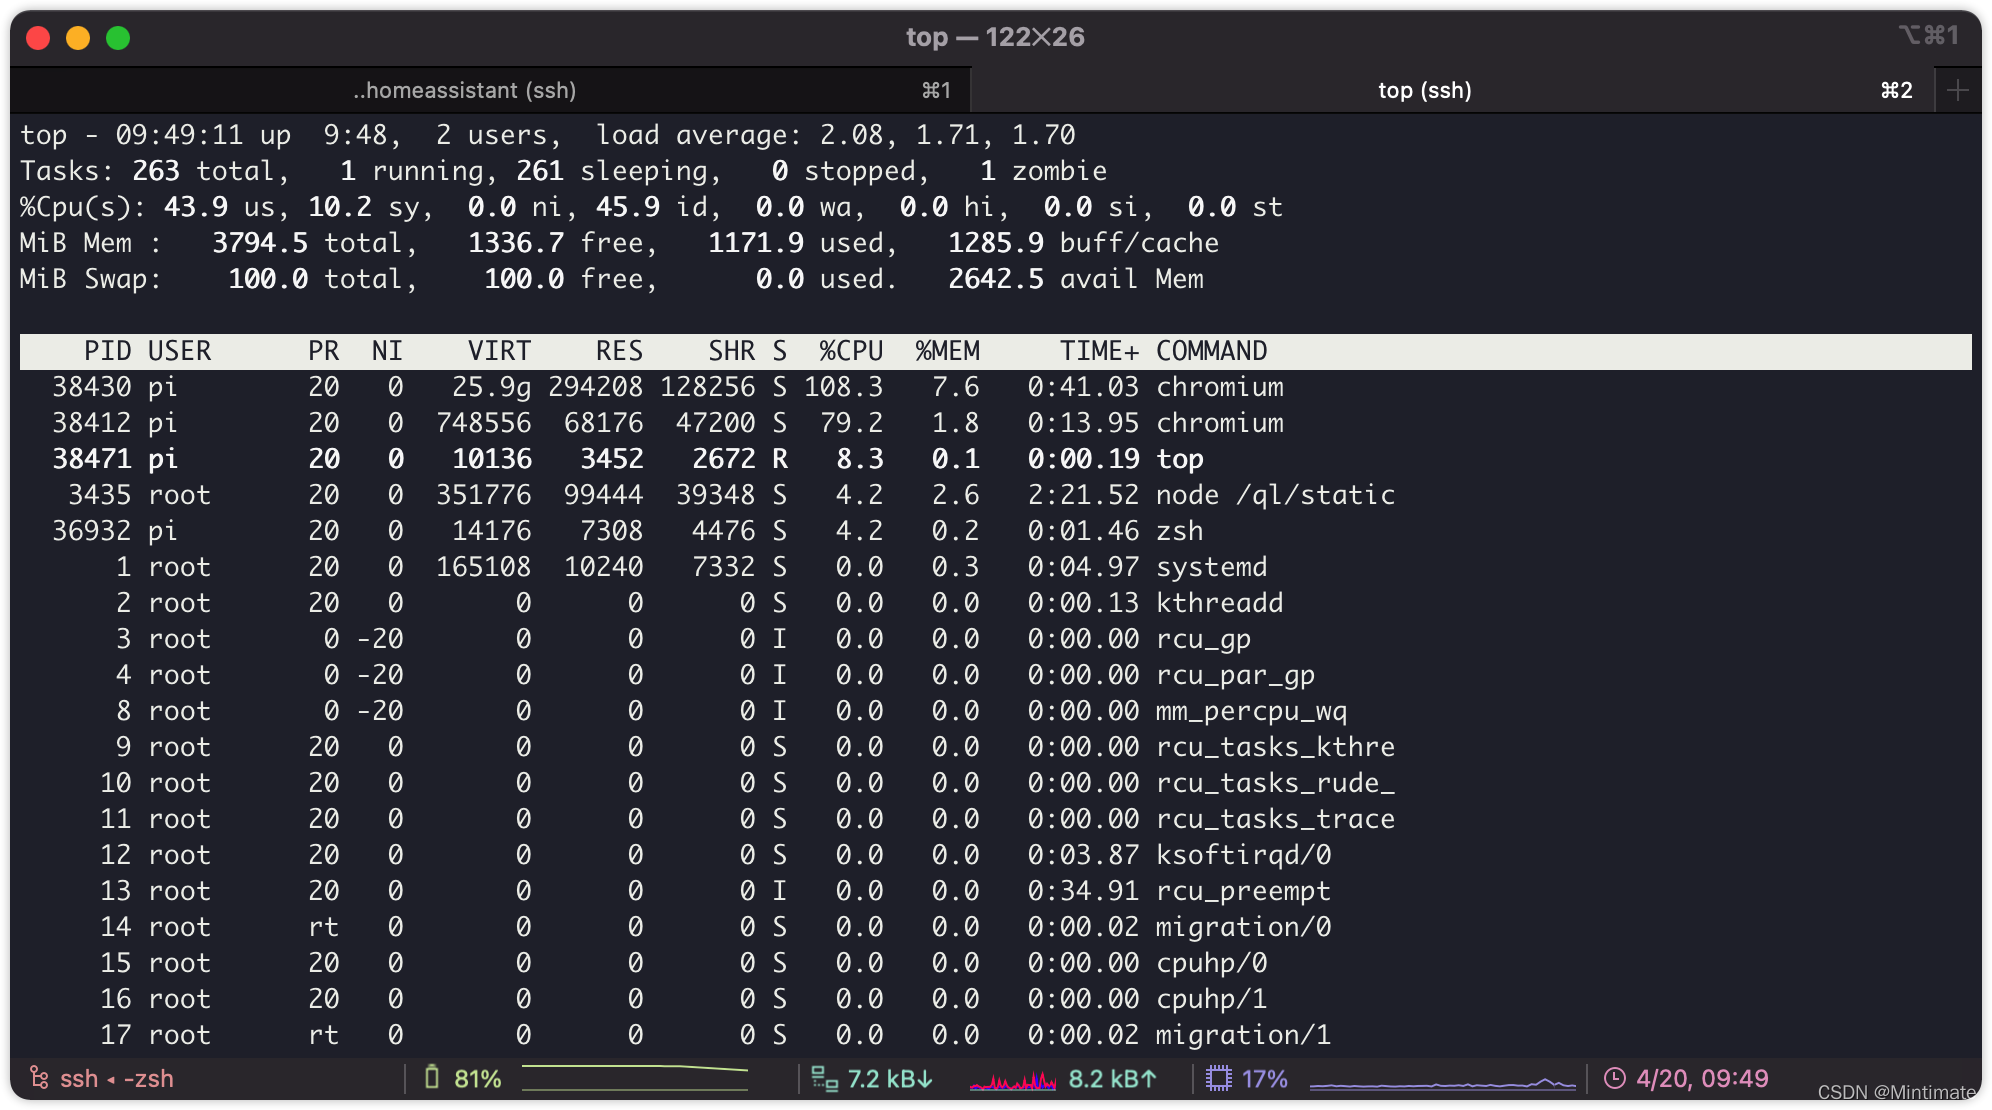
加上-n1代表取消交互模式,只获取一次输出刷新。配合awk实现字段截取。
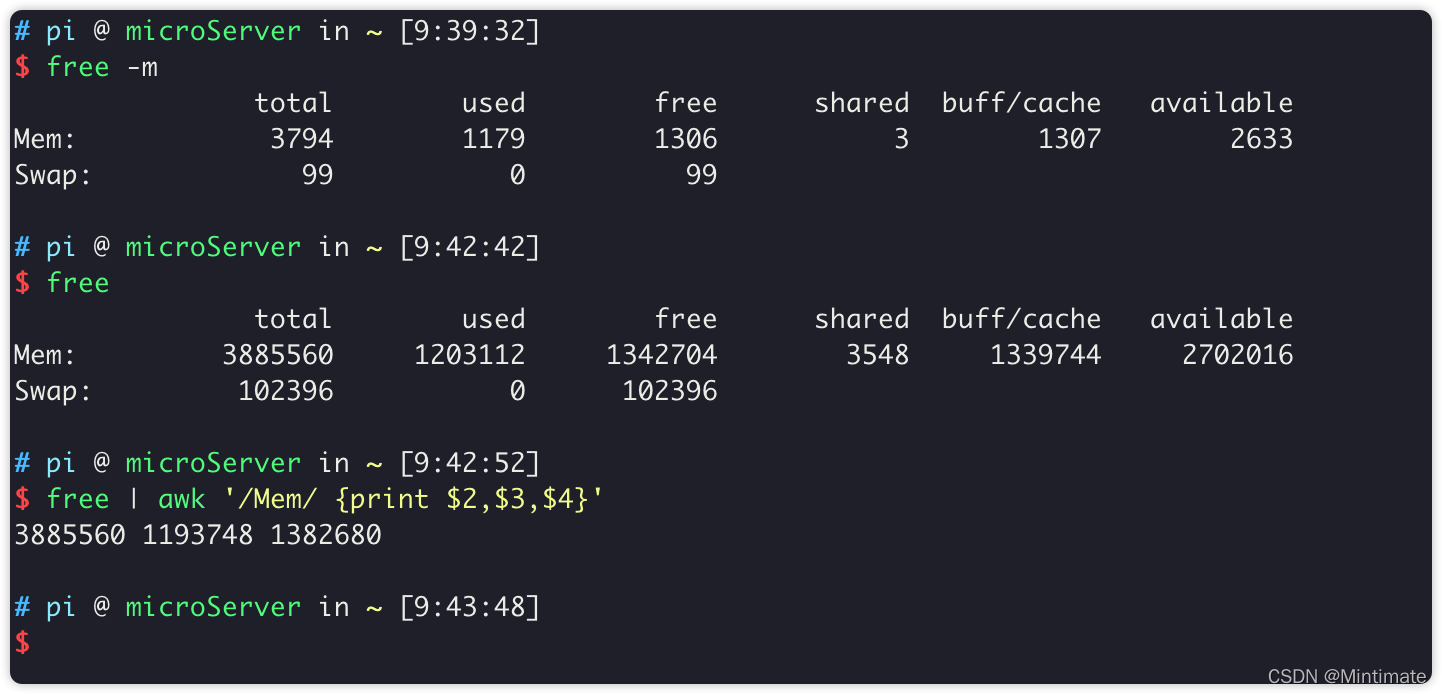
内存使用
内存的话,就更简单了,直接使用free命令,配合“三剑客”中的awk即可:
free | awk '/Mem/ {print $2,$3,$4}'
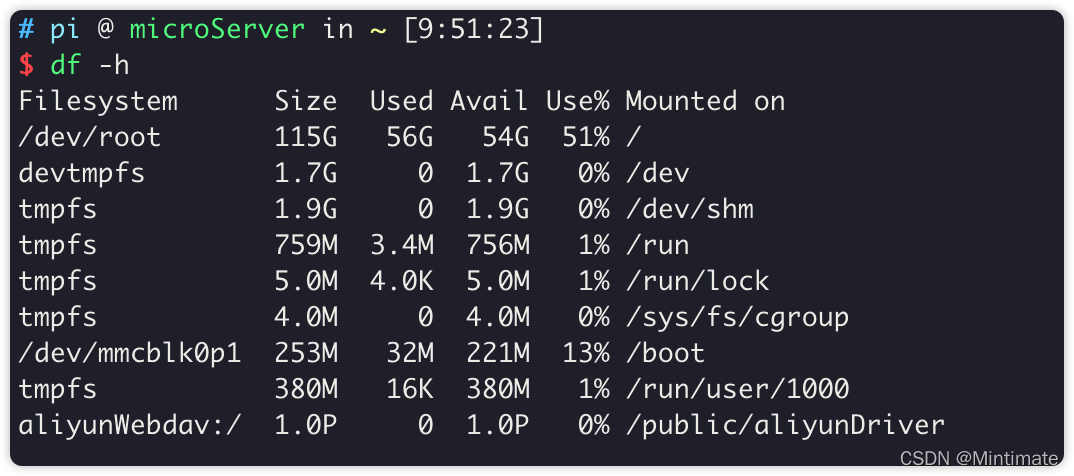
磁盘使用
磁盘使用就很简单了,信息大家都清楚。只需要:
df -h
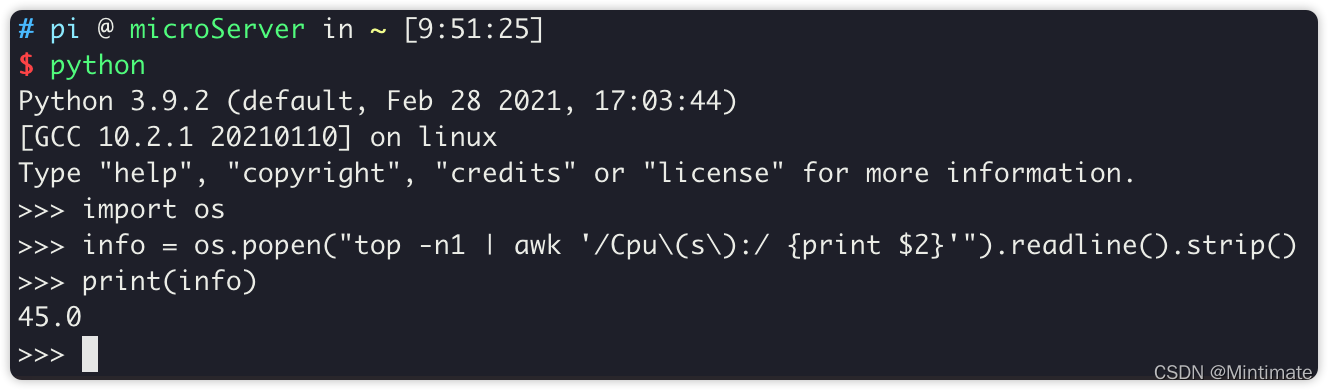
Python封装
之后,我们把上述的Shell命令,使用Python脚本去调用。只需要使用Python的os包,配合os.popen方法即可运行Shell命令。比如:
# 获取CPU使用率
import os
info = os.popen("top -n1 | awk '/Cpu\(s\):/ {print $2}'").readline().strip()
print(info)
扩展一下,把前一章节的所有信息全部获取并封装为JSON对象:
import os
import json

# Return CPU temperature as a float
def getCPUtemperature():
    f = os.popen("cat /sys/class/thermal/thermal_zone0/temp")
    temp = int(f.readline().strip())/1000
    return round(temp, 1)

# Return RAM information (unit=MB) in a list
# Index 0: total RAM
# Index 1: used RAM
# Index 2: free RAM
def getRAMinfo():
    f = os.popen("free | awk '/Mem/ {print $2,$3,$4}'")
    info = f.readline().split()
    info = [round(int(i)/1024, 1) for i in info]
    return info

# Return % of CPU used by user as float
def getCPUinfo():
    # Docker外部(真实环境内)
    ## info = os.popen("top -n1 | awk '/Cpu\(s\):/ {print $2}'").readline().strip()
    # Docker内部(Home Assistant Docker内)
    info = os.popen("top -n1 | awk '/CPU:/ {print $2}'").readline().strip()
    if info=="":
        info=0
    return info

# Return information about disk space as a list (unit included)
# Index 0: total disk space
# Index 1: used disk space
# Index 2: remaining disk space
# Index 3: percentage of disk used
def getDiskinfo():
    f = os.popen("df -h /")
    info = f.readlines()[1].split()[1:5]
    return info

if __name__ == '__main__':
    RaspiInfo = {

    }
    RaspiInfo['CPUtemp'] = getCPUtemperature()
    RaspiInfo['RAMinfo'] = getRAMinfo()
    RaspiInfo['DISKinfo'] = getDiskinfo()
    RaspiInfo['CPUuse'] = getCPUinfo()
    # 必须转化为标准 JSON 格式
    print(json.dumps(RaspiInfo))
获取运行一下:

之后,我们就是Home Assistant上调用了。
需要注意:CPU使用的获取,Home Assistant内使用的是Docker环境;所以top命令获取的CPU和真实环境获取CPU信息不一样。
Command Senior
参考官方文档:https://www.home-assistant.io/integrations/sensor.command_line/
我们需要创建一个Command Line传感器,为了避免为的Home Assistant核心配置文件过长,我这里使用YAML外部引用的方式,引用一个单独的配置文件进行追加:
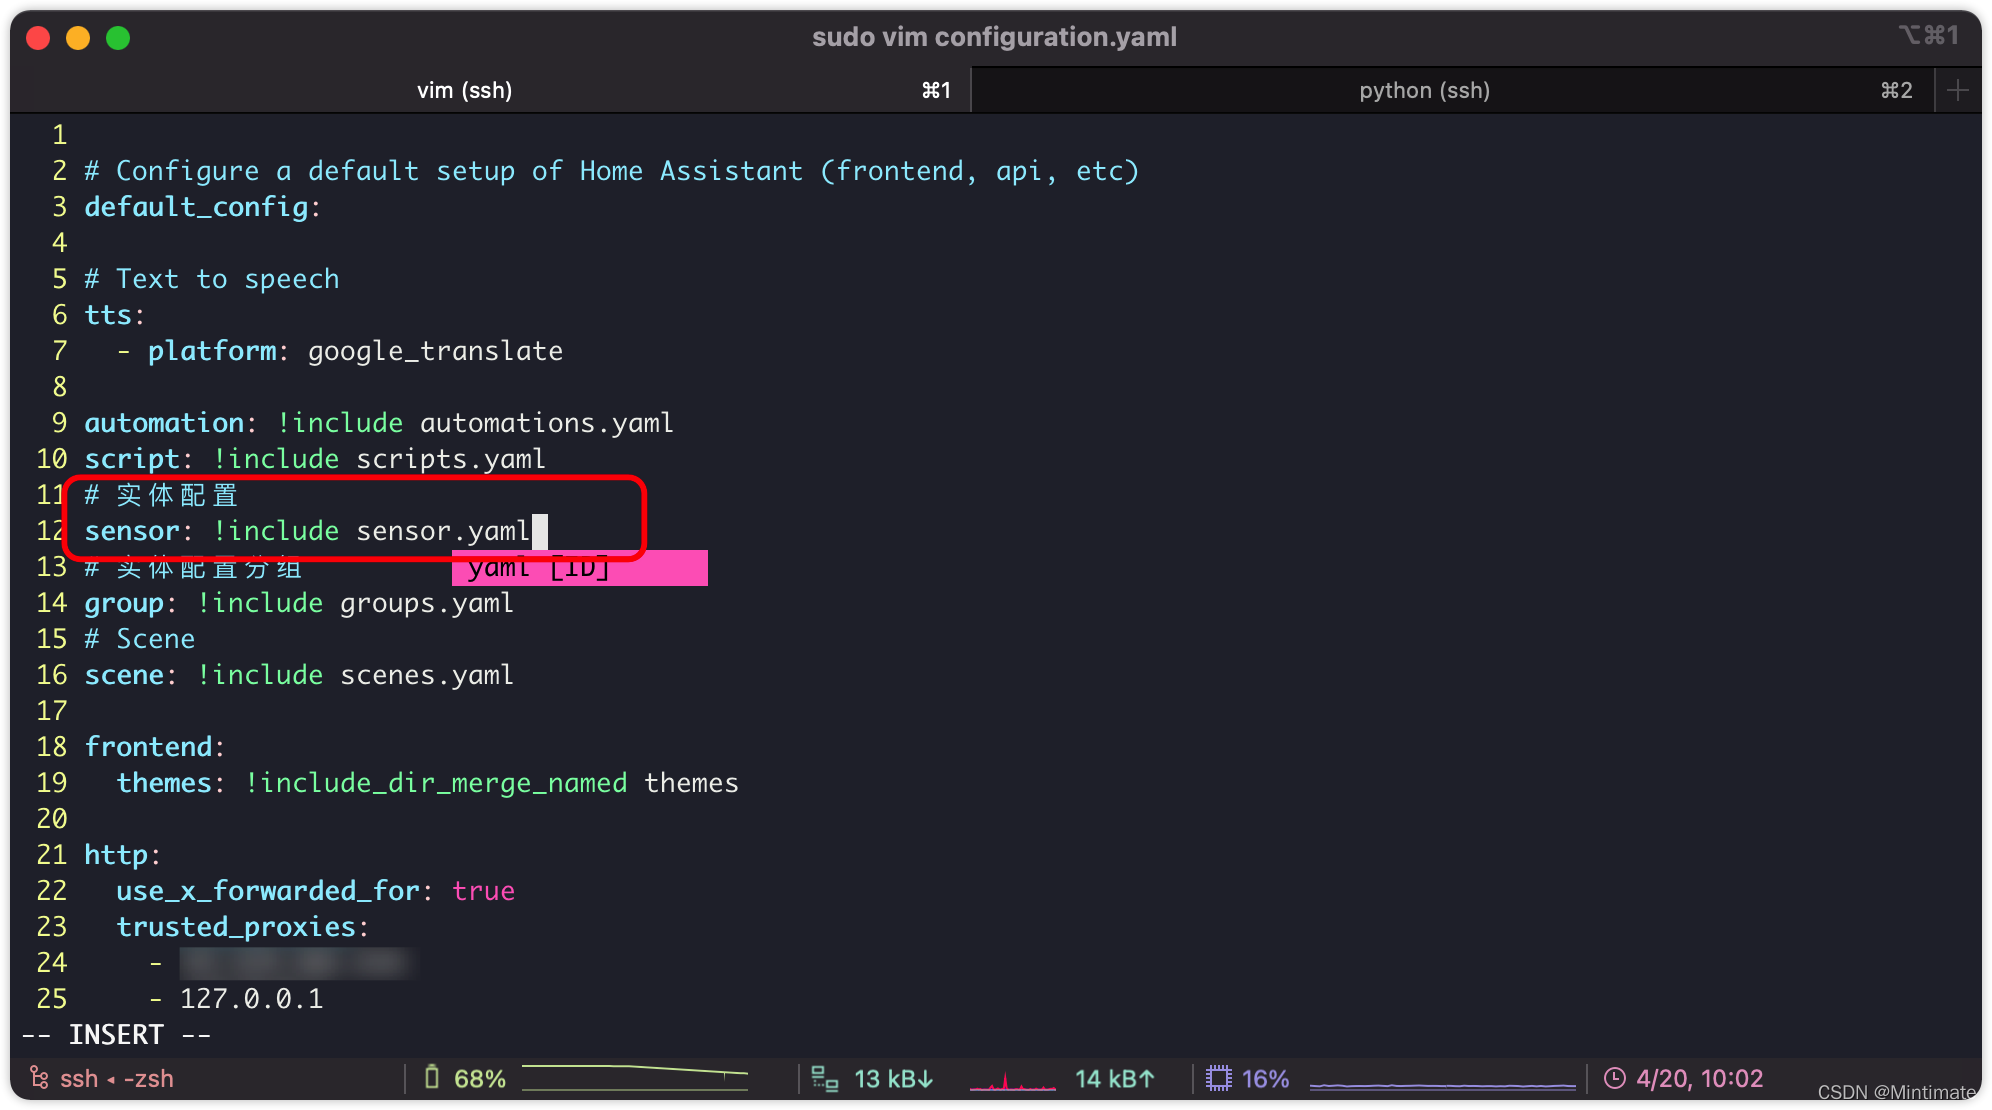
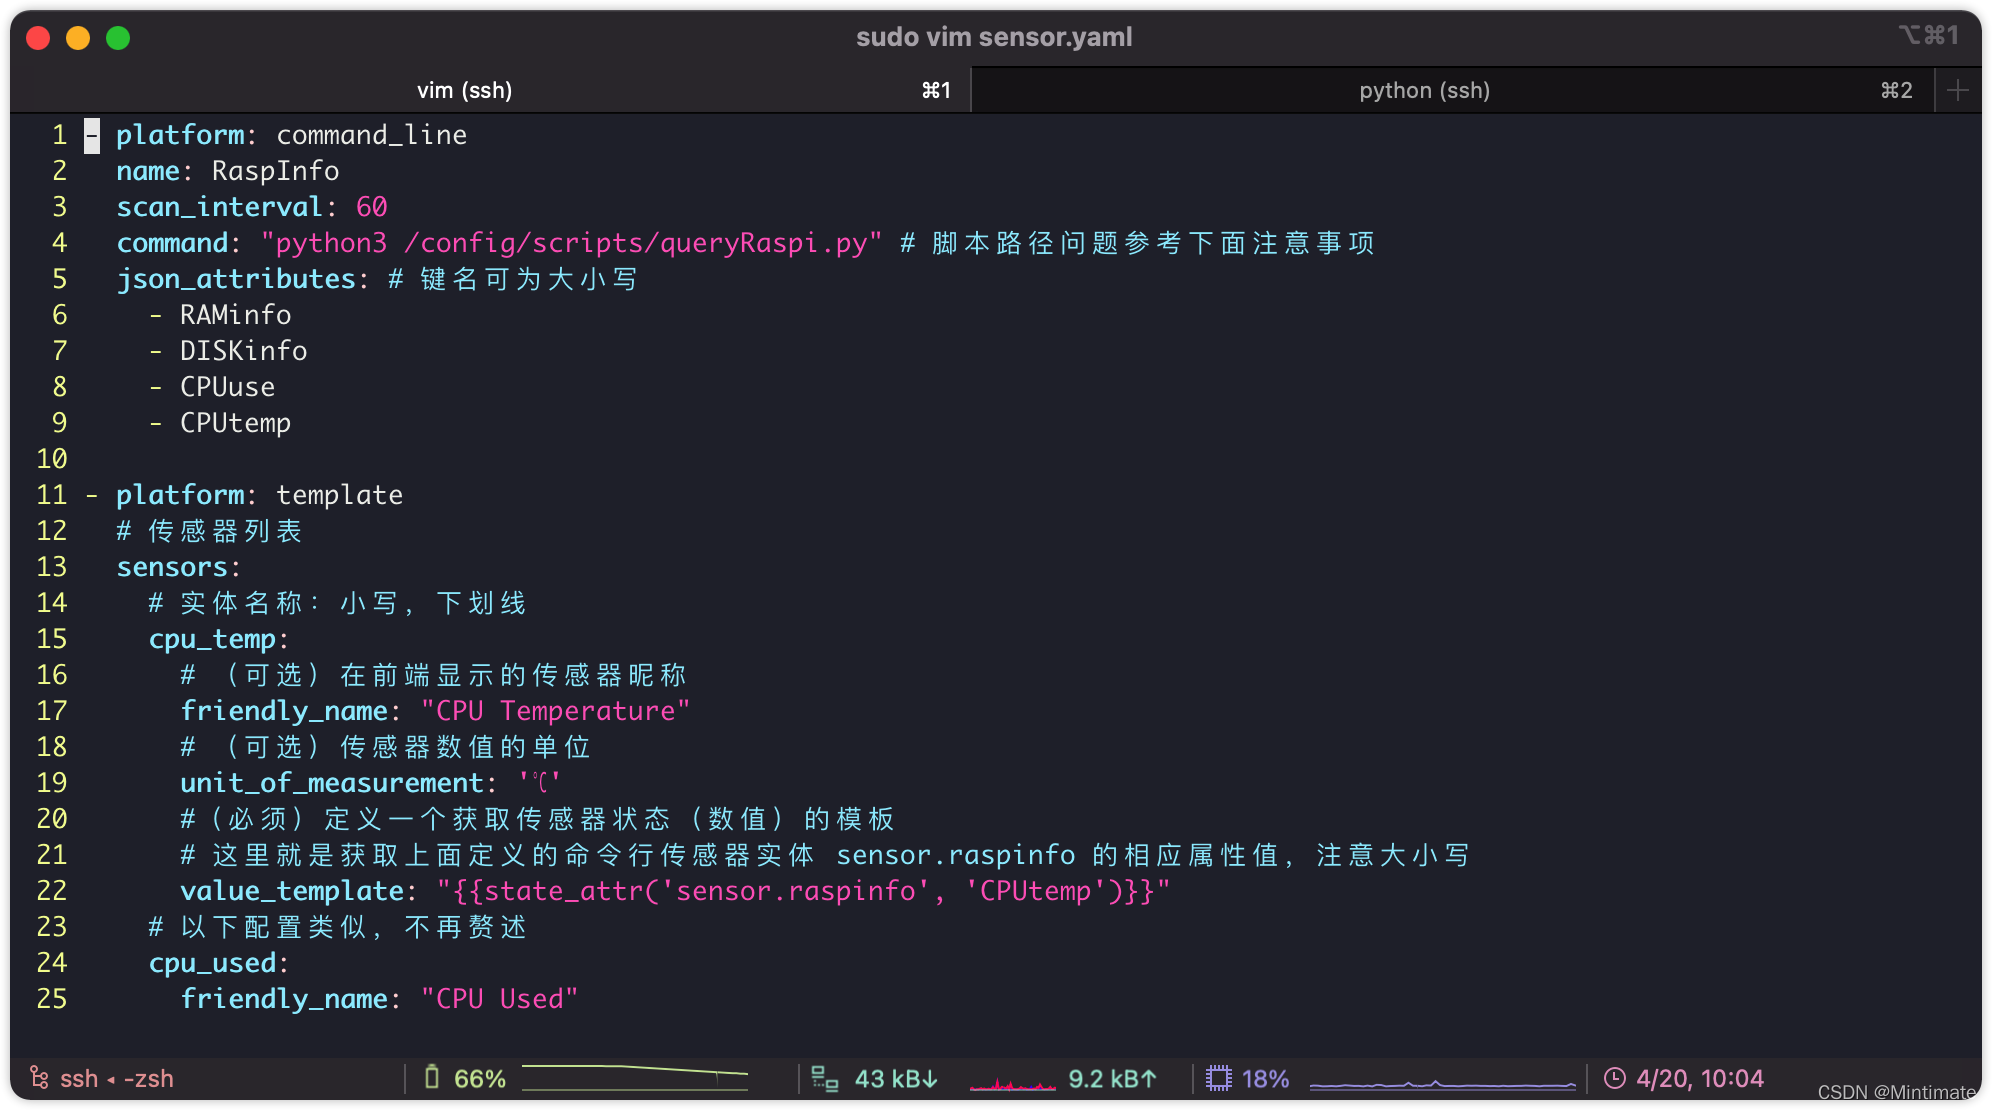
之后,创建Command Line传感器配置:
- platform: command_line
  name: RaspInfo
  scan_interval: 60
  command: "python3 /config/scripts/queryRaspi.py" # 脚本路径问题参考下面注意事项
  json_attributes: # 键名可为大小写
    - RAMinfo
    - DISKinfo
    - CPUuse
    - CPUtemp

- platform: template
  # 传感器列表
  sensors:
    # 实体名称:小写,下划线
    cpu_temp:
      # (可选)在前端显示的传感器昵称
      friendly_name: "CPU Temperature"
      # (可选)传感器数值的单位
      unit_of_measurement: '℃'
      #(必须)定义一个获取传感器状态(数值)的模板
      # 这里就是获取上面定义的命令行传感器实体 sensor.raspinfo 的相应属性值,注意大小写
      value_template: "{

    {state_attr('sensor.raspinfo', 'CPUtemp')}}"
    # 以下配置类似,不再赘述
    cpu_used:
      friendly_name: "CPU Used"
      # unit_of_measurement: '%'
      value_template: "{

    {state_attr('sensor.raspinfo', 'CPUuse')}}"
    ram_total:
      friendly_name: "RAM total"
      unit_of_measurement: 'MB'
      value_template: "{

    {state_attr('sensor.raspinfo', 'RAMinfo')[0]}}"
    ram_used:
      friendly_name: "RAM used"
      unit_of_measurement: 'MB'
      value_template: "{

    {state_attr('sensor.raspinfo', 'RAMinfo')[1]}}"
    ram_free:
      friendly_name: "RAM free"
      unit_of_measurement: 'MB'
      value_template: "{

    {state_attr('sensor.raspinfo', 'RAMinfo')[2]}}"
    disk_total:
      friendly_name: "DISK total"
      value_template: "{

    {state_attr('sensor.raspinfo', 'DISKinfo')[0]}}"
    disk_used:
      friendly_name: "DISK used"
      value_template: "{

    {state_attr('sensor.raspinfo', 'DISKinfo')[1]}}"
    disk_left:
      friendly_name: "DISK left"
      value_template: "{

    {state_attr('sensor.raspinfo', 'DISKinfo')[2]}}"
    disk_percentage:
      friendly_name: "DISK percentage"
      value_template: "{

    {state_attr('sensor.raspinfo', 'DISKinfo')[3]}}"
其中:
platform-command为我们刚刚写的Python脚本 ,注意自己的文件地址。
保存后,重启树莓派上的Home Assistant,就可以看到效果:
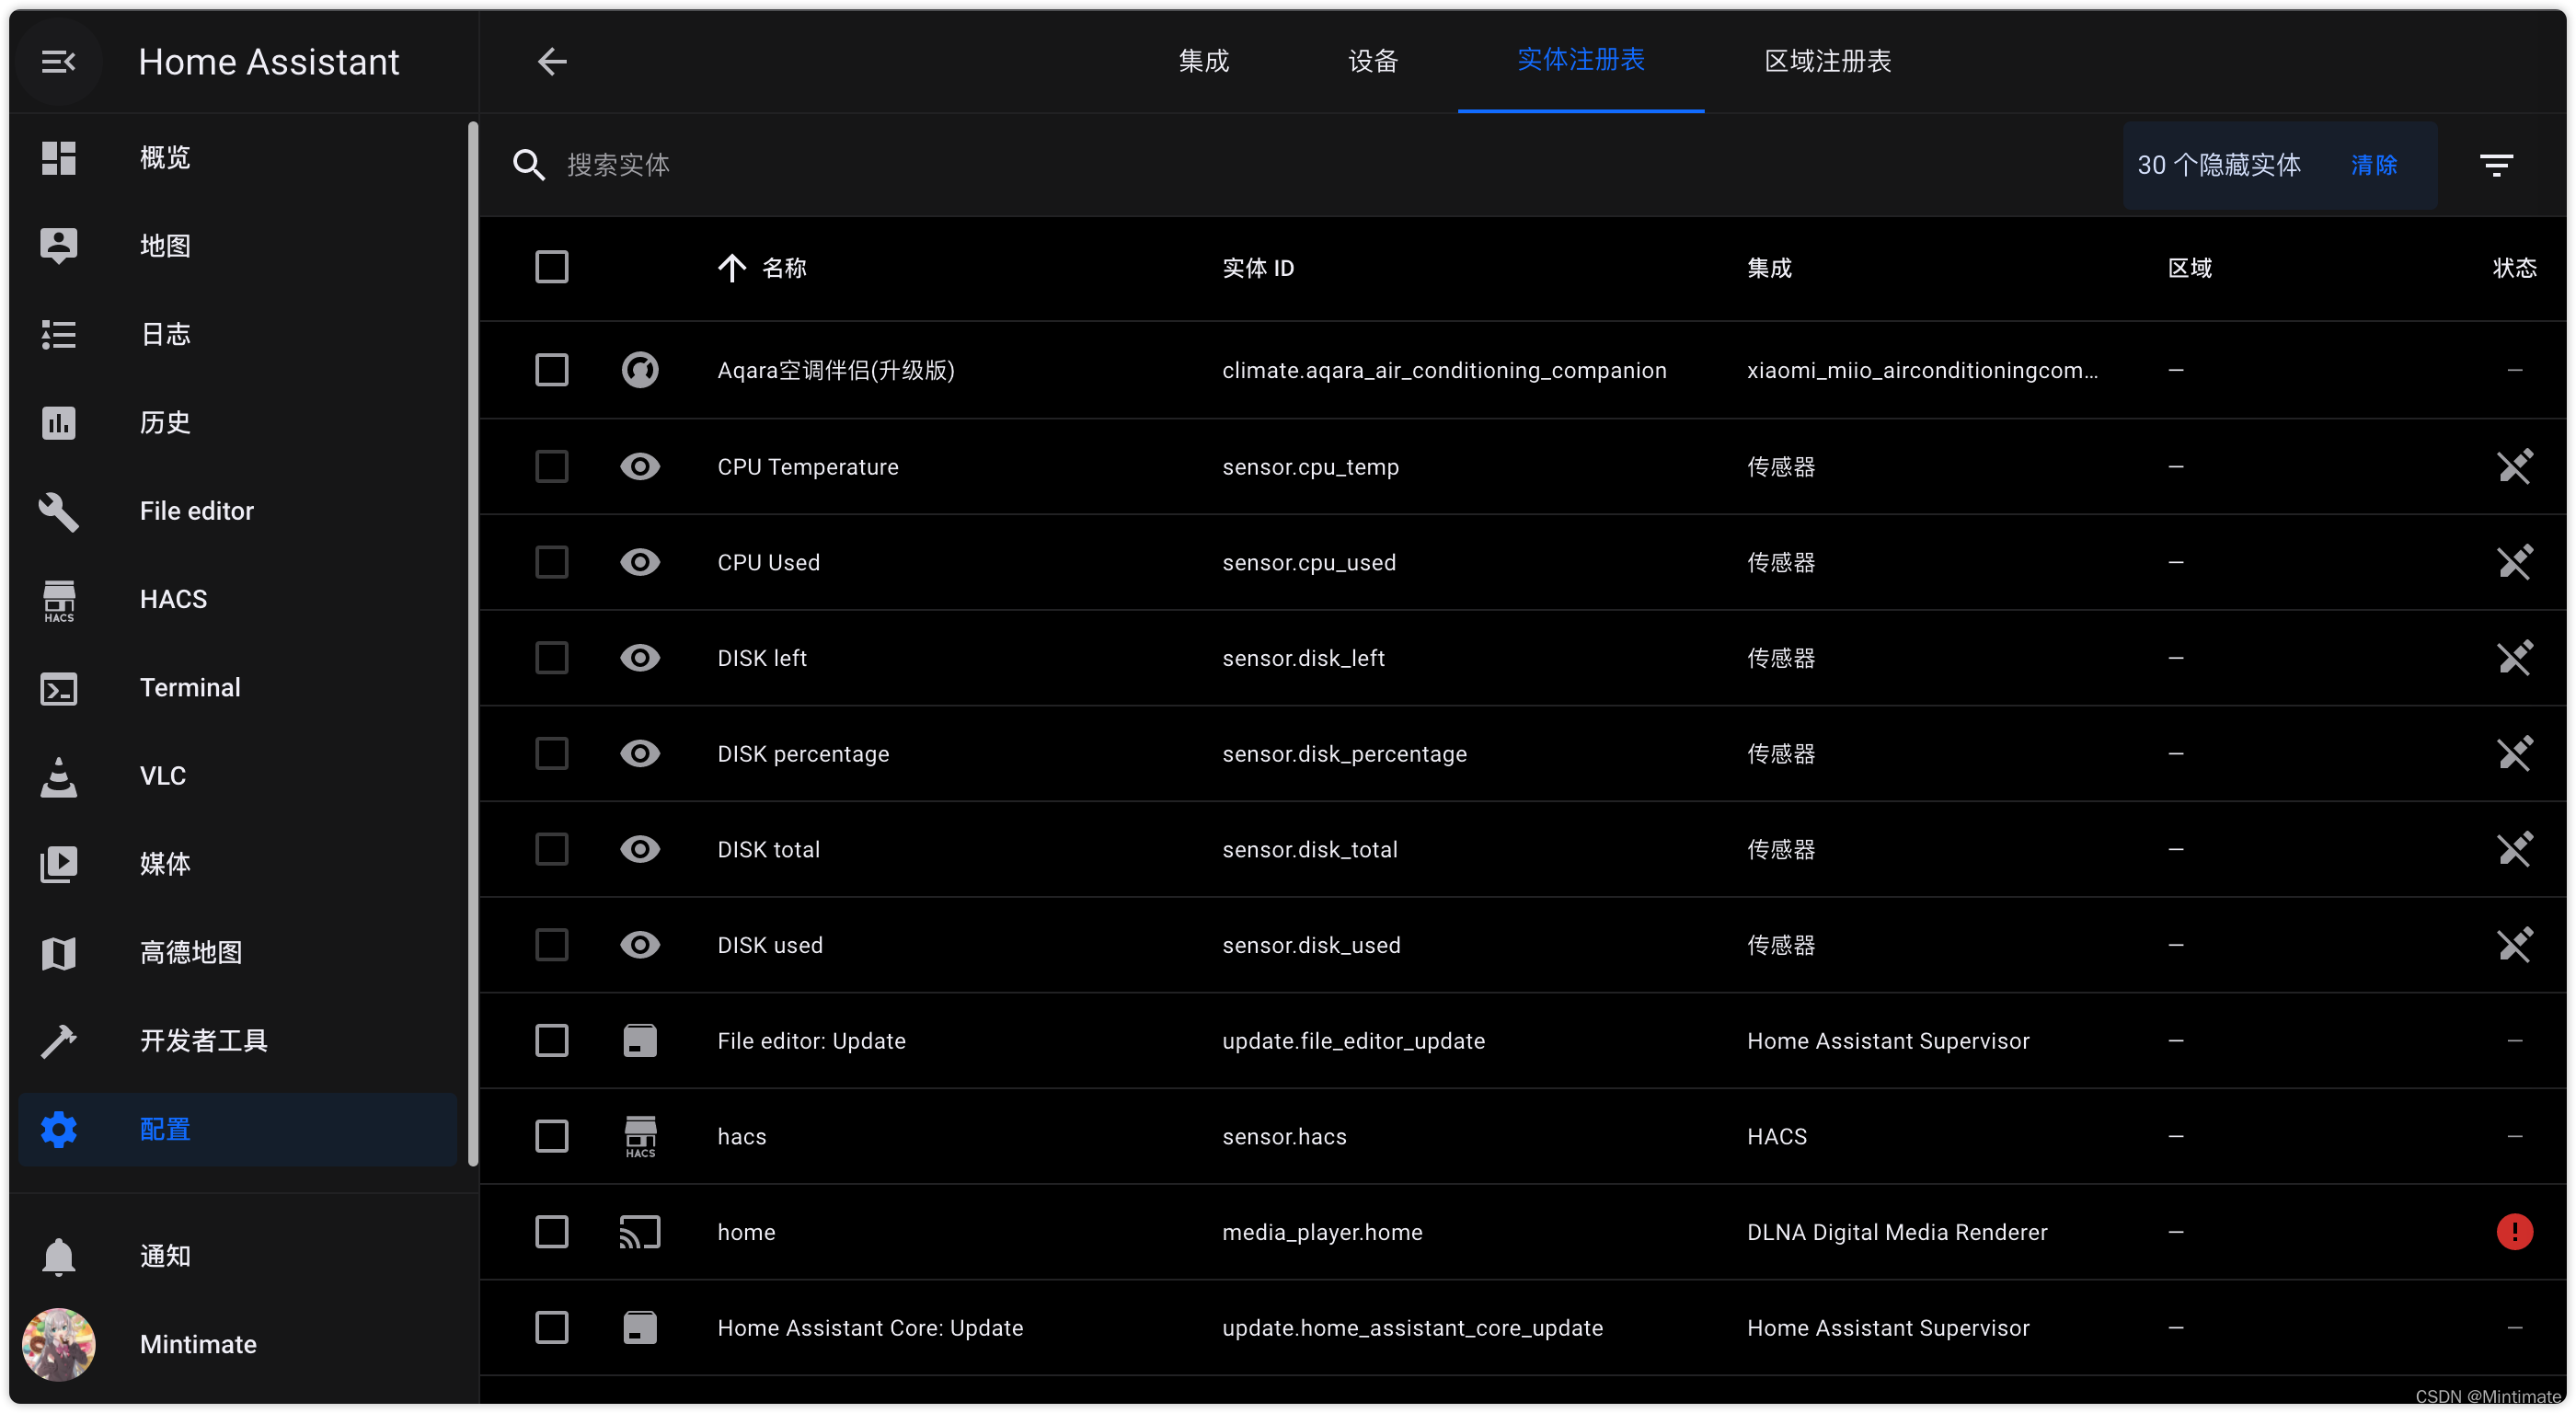
到此,其实就可以去添加展示卡片了。但是,我看其他人还会把多个传感器组合成一个group,这样确实更方便查找实体传感器对象数据,所以,我们也来做一下。
Group
的确,Group就和SQL的group by类似。使用Group分组后,可以把多个没有联系的对象,组合成一个关联性的 ,比如:
很简单,我们根据官方文档:https://www.home-assistant.io/integrations/group
来编辑一个group对象。
和刚刚一样,为了避免我的配置文件过长:
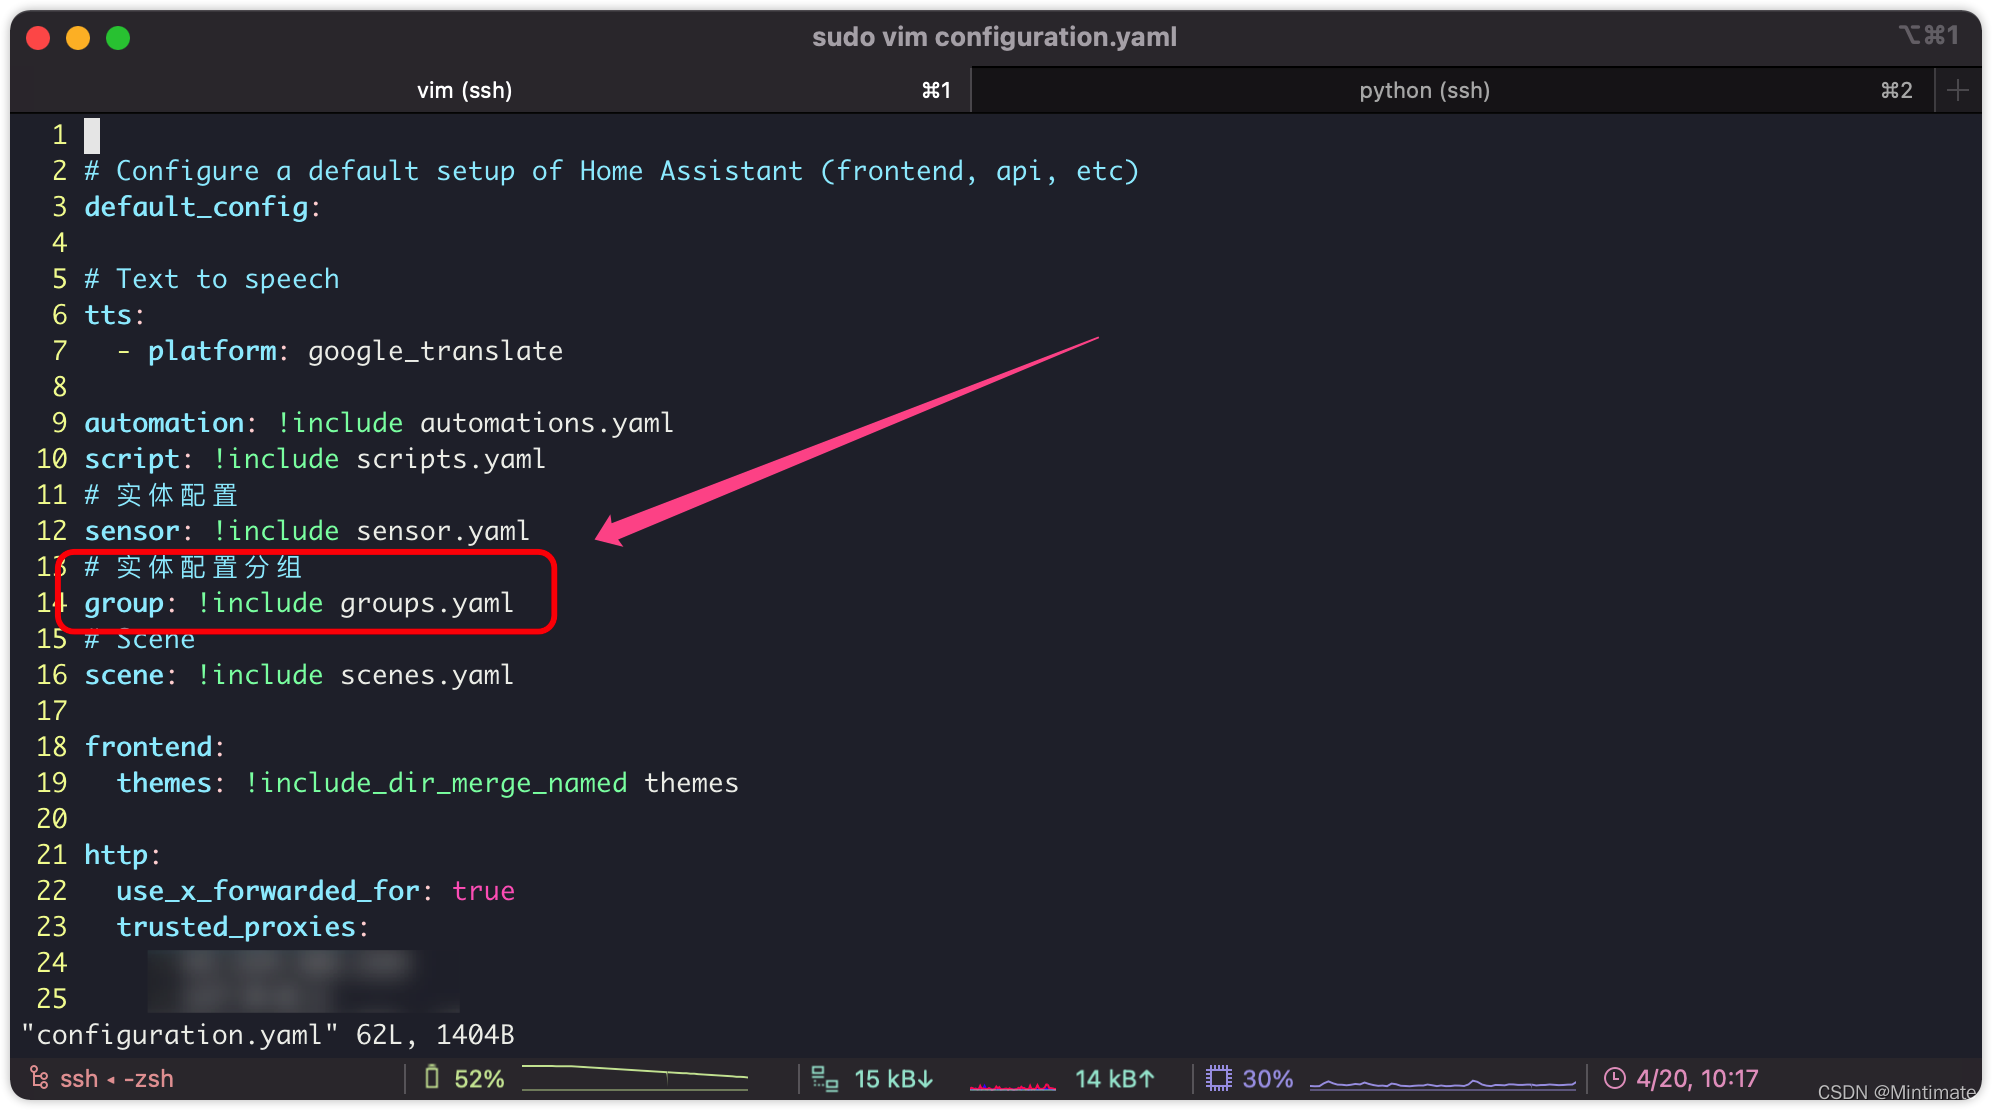
之后,创建groups.yaml文件,并添加以下内容:
raspinfo:
  name: 树莓派
  entities:
    - sensor.cpu_used
    - sensor.cpu_temp
    - sensor.ram_total
    - sensor.ram_used
    - sensor.ram_free
    - sensor.disk_total
    - sensor.disk_used
    - sensor.disk_left
    - sensor.disk_percentage
保存并重启Home Assistant即可。
END
其实,top命令自身就挺消耗树莓派资源的。如果不是经常需要检测树莓派,可以试试不监控CPU使用。
卡片效果,可以参考GitHub项目:https://github.com/RomRider/apexcharts-card