引言
这里将汇总一些比较偏门的小改动,会持续更新。虽然这些看上去确实没什么大用,但为了需要时可以直接调用,还是想汇总以方便查阅。
识别框线条粗细修改
在plots.py的plot_one_box函数中将tl值改掉

tl = 30
默认

线条粗细为10

线条粗细为30
识别框颜色修改

color = (255,0,255)
(255,0,255)代表紫色
目前对plot_one_box()函数的改动如下
def plot_one_box(x, img, color=None, label=None, line_thickness=3):
    # Plots one bounding box on image img
    tl = line_thickness or round(0.002 * (img.shape[0] + img.shape[1]) / 2) + 1  # line/font thickness
    #tl = 10
    color = color or [random.randint(0, 255) for _ in range(3)]
    #color = (255,0,255)
    c1, c2 = (int(x[0]), int(x[1])), (int(x[2]), int(x[3]))
    cv2.rectangle(img, c1, c2, color, thickness=tl, lineType=cv2.LINE_AA)
    # #################################打印坐标#############################
    # print("左上点的坐标为:(" + str(c1[0]) + "," + str(c1[1]) + "),右上点的坐标为(" + str(c2[0]) + "," + str(c1[1]) + ")")
    # print("左下点的坐标为:(" + str(c1[0]) + "," + str(c2[1]) + "),右下点的坐标为(" + str(c2[0]) + "," + str(c2[1]) + ")")
    # print("中心点的坐标为:(" + str((c2[0] - c1[0]) / 2 + c1[0]) + "," + str((c2[1] - c1[1]) / 2 + c1[1]) + ")")
    # #####################################################################
    if label:
        tf = max(tl - 1, 1)  # font thickness
        t_size = cv2.getTextSize(label, 0, fontScale=tl / 3, thickness=tf)[0]
        c2 = c1[0] + t_size[0], c1[1] - t_size[1] - 3
        cv2.rectangle(img, c1, c2, color, -1, cv2.LINE_AA)  # filled
        cv2.putText(img, label, (c1[0], c1[1] - 2), 0, tl / 3, [225, 255, 255], thickness=tf, lineType=cv2.LINE_AA)
label显示修改

label = '%s %.2f  xxx: %d' % (names[int(cls)], conf, 1234)
#改成标准输出格式,方便添加其他变量(原代码只显示类别名和置信度)
修改前
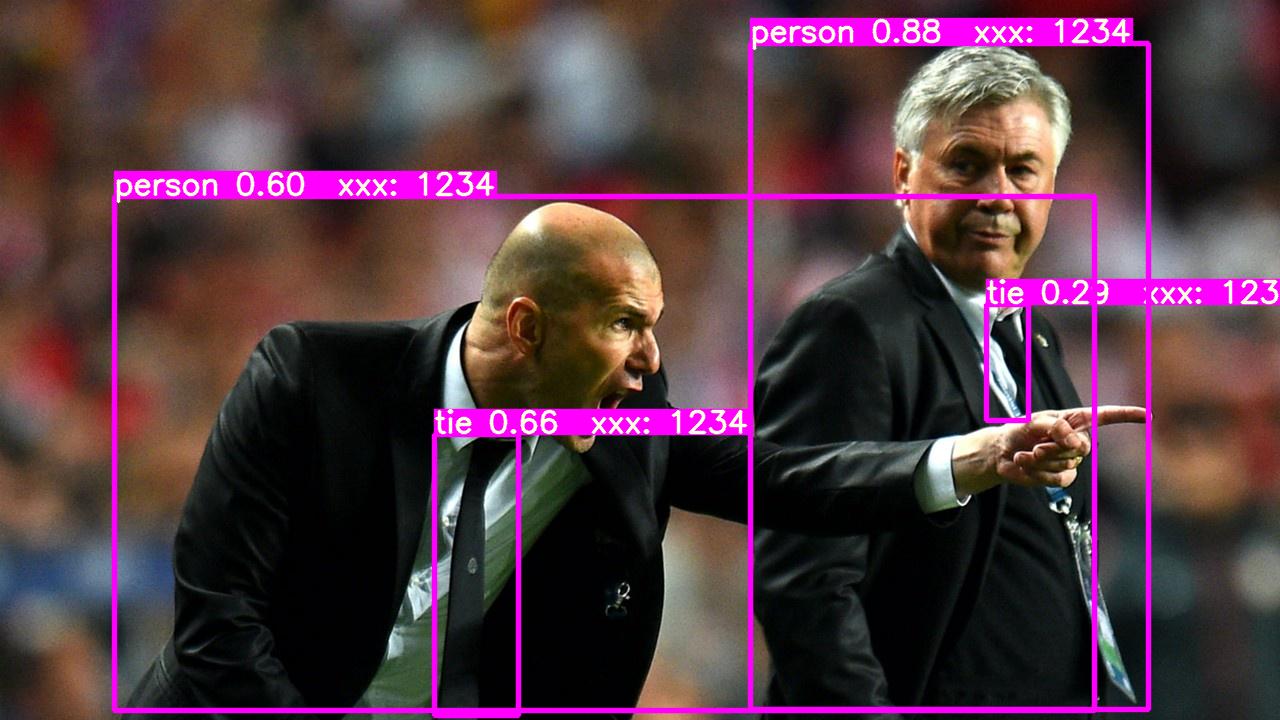
修改后(这里只是举个例子,没什么特殊含义)
求学路上,你我共勉(๑•̀ㅂ•́)و✧