欢迎大家访问个人博客:https://jmxgodlz.xyz
前言
看到有些论文插图十分简洁美观,于是便摸索一下如何美化一下折线图绘图。本文将在前文Python数据分析-数据可视化的基础上,介绍折线图格式的调整。
本文使用的画图工具为matplotlib,相关API可访问python matplotlib文档。

Matplotlib 折线图格式调整
首先,贴一下文档中折线图绘制的附加参数表:
| Property | Description |
|---|---|
| agg_filter | a filter function, which takes a (m, n, 3) float array and a dpi value, and returns a (m, n, 3) array |
| alpha | scalar or None |
| animated | bool |
| antialiased or aa | bool |
| clip_box | Bbox |
| clip_on | bool |
| clip_path | Patch or (Path, Transform) or None |
| color or c | color |
| dash_capstyle | CapStyle or {‘butt’, ‘projecting’, ‘round’} |
| dash_joinstyle | JoinStyle or {‘miter’, ‘round’, ‘bevel’} |
| dashes | sequence of floats (on/off ink in points) or (None, None) |
| data | (2, N) array or two 1D arrays |
| drawstyle or ds | {‘default’, ‘steps’, ‘steps-pre’, ‘steps-mid’, ‘steps-post’}, default: ‘default’ |
| figure | Figure |
| fillstyle | {‘full’, ‘left’, ‘right’, ‘bottom’, ‘top’, ‘none’} |
| gid | str |
| in_layout | bool |
| label | object |
| linestyle or ls | {’-’, ‘–’, ‘-.’, ‘:’, ‘’, (offset, on-off-seq), …} |
| linewidth or lw | float |
| marker | marker style string, Path or MarkerStyle |
| markeredgecolor or mec | color |
| markeredgewidth or mew | float |
| markerfacecolor or mfc | color |
| markerfacecoloralt or mfcalt | color |
| markersize or ms | float |
| markevery | None or int or (int, int) or slice or list[int] or float or (float, float) or list[bool] |
| path_effects | AbstractPathEffect |
| picker | float or callable[[Artist, Event], tuple[bool, dict]] |
| pickradius | float |
| rasterized | bool |
| sketch_params | (scale: float, length: float, randomness: float) |
| snap | bool or None |
| solid_capstyle | CapStyle or {‘butt’, ‘projecting’, ‘round’} |
| solid_joinstyle | JoinStyle or {‘miter’, ‘round’, ‘bevel’} |
| transform | unknown |
| url | str |
| visible | bool |
| xdata | 1D array |
| ydata | 1D array |
| zorder | float |
接下来,我将挑选几个常用的附加参数介绍使用方式与效果。
标签
- 附加参数名:label
- 功能:为绘制曲线命名,该名称会在图例显示
- 使用方式:plt.plot(x,y,label=‘example’)
import random

import matplotlib.pyplot as plt

x = range(10)
y = [random.random() for _ in range(10)]

plt.figure()
plt.plot(x, y, label='example')
plt.legend()
plt.show()

线条颜色
- 附加参数名:color
- 功能:选择绘制线条的颜色
- 使用方式:plt.plot(x,y,color=‘r’)
- 颜色选取方式分为三种:
- 用全名或简称 ,如blue或b
- 16进制 ,如FF00FF
- (r, g, b) 或 (r, g, b, a),如(1,0,1,1) ,其中 r g b a 取均为[0, 1]之间,[0, 1]之间的浮点数的字符串形式,表示灰度值。0表示黑色,1表示白色
import random

import matplotlib.pyplot as plt

x = range(10)
y = [random.random() for _ in range(10)]
y2 = [random.random() for _ in range(10)]
y3 = [random.random() for _ in range(10)]
y4 = [random.random() for _ in range(10)]

plt.figure()
plt.plot(x, y, label='example1', color='blue')
plt.plot(x, y2, label='example2', color='r')
plt.plot(x, y3, label='example3', color='#00FFFF')
plt.plot(x, y4, label='example4', color=(0.4, 0.5, 0.6))
plt.legend()
plt.show()

线条形状
- 附加参数名:linestyle(或ls)
- 功能:选择绘制线条的形状
- 使用方式:plt.plot(x,y,linestyle=’:’)或者plt.plot(x,y,ls=’:’)
- 常用形状:
- - 实线(solid)
- – 短线(dashed)
- -. 短点相间线(dashdot)
- : 虚点线(dotted)
- ‘’, ’ ', None
import random

import matplotlib.pyplot as plt

x = range(10)
y = [random.random() for _ in range(10)]
y2 = [random.random() for _ in range(10)]
y3 = [random.random() for _ in range(10)]
y4 = [random.random() for _ in range(10)]

plt.figure()
plt.plot(x, y, label='example1', color='blue', linestyle='-')
plt.plot(x, y2, label='example2', color='r', ls='--')
plt.plot(x, y3, label='example3', color='#00FFFF', ls=':')
plt.plot(x, y4, label='example4', color=(0.4, 0.5, 0.6), ls='')
plt.legend()
plt.show()

折点样式
- 附加参数名:
(1)marker – 折点形状
(2)markeredgecolor 或 mec – 折点外边颜色
(3)markeredgewidth 或 mew – 折点线宽
(4)markerfacecolor 或 mfc --折点实心颜色
(5)markerfacecoloralt 或 mfcalt
(6)markersize 或 ms --折点大小
折点形状选择如下表:
| character | description |
|---|---|
'-' |
solid line style |
'--' |
dashed line style |
'-.' |
dash-dot line style |
':' |
dotted line style |
'.' |
point marker |
',' |
pixel marker |
'o' |
circle marker |
'v' |
triangle_down marker |
'^' |
triangle_up marker |
'<' |
triangle_left marker |
'>' |
triangle_right marker |
'1' |
tri_down marker |
'2' |
tri_up marker |
'3' |
tri_left marker |
'4' |
tri_right marker |
's' |
square marker |
'p' |
pentagon marker |
'*' |
star marker |
'h' |
hexagon1 marker |
'H' |
hexagon2 marker |
'+' |
plus marker |
'x' |
x marker |
'D' |
diamond marker |
'd' |
thin_diamond marker |
| ``’ | '`` |
'_' |
hline marker |
import random

import matplotlib.pyplot as plt

x = range(10)
y = [random.random() for _ in range(10)]
y2 = [random.random() for _ in range(10)]
y3 = [random.random() for _ in range(10)]
y4 = [random.random() for _ in range(10)]

plt.figure()
plt.plot(x, y, label='example1', color='blue', linestyle='-', marker='o')
plt.plot(x, y2, label='example2', color='r', ls='--', marker='1')
plt.plot(x, y3, label='example3', color='#00FFFF', ls=':', marker='2')
plt.plot(x, y4, label='example4', color=(0.4, 0.5, 0.6), marker='3')
plt.legend()
plt.show()

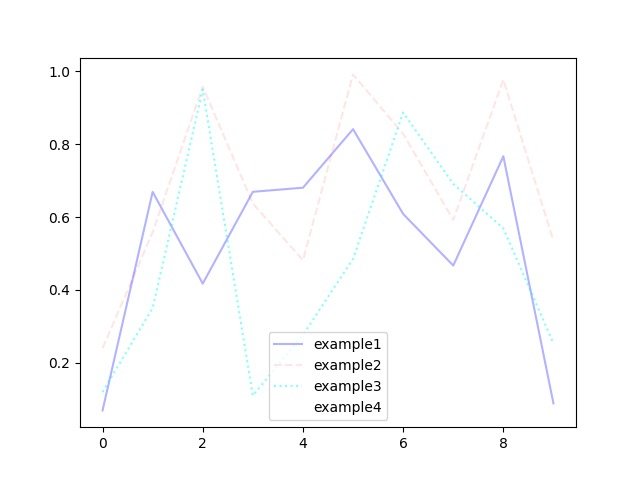
线条透明度
- 附加参数名:alpha,值在[0,1]之间
- 功能:选择绘制线条的透明度
- 使用方式:plt.plot(x,y,alpha=‘0.9’)
import random

import matplotlib.pyplot as plt

x = range(10)
y = [random.random() for _ in range(10)]
y2 = [random.random() for _ in range(10)]
y3 = [random.random() for _ in range(10)]
y4 = [random.random() for _ in range(10)]

plt.figure()
plt.plot(x, y, label='example1', color='blue', linestyle='-', alpha=0.3)
plt.plot(x, y2, label='example2', color='r', ls='--', alpha=0.1)
plt.plot(x, y3, label='example3', color='#00FFFF', ls=':', alpha=0.5)
plt.plot(x, y4, label='example4', color=(0.4, 0.5, 0.6), ls='')
plt.legend()
plt.show()