1.Harris角点检测
1.1原理
角点
通常意义上来说,角点就是极值点,即在某方面属性特别突出的点,是在某些属性上强度最大或者最小的孤立点、线段的终点。而对于图像而言,如图所示红点部分,即为图像的角点,其是物体轮廓线的连接点。
角点检测
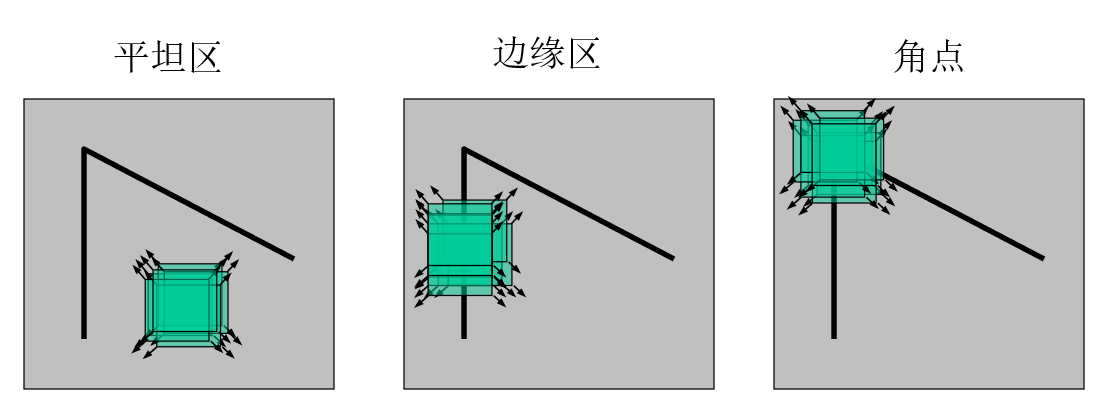
对于图像的角点判断,可以假想出一个正方形的小窗口,如果小窗口在图像以任意方向进行移动,导致图像灰度的明显变化,那么我们就可以认为小窗口内部包含了“角点”,或者当窗口足够小时,可以认为该窗口就是角点。
 当窗口位于平坦区时,任意方向移动都没有灰度变化。
当窗口位于边缘区时,沿边缘方向移动无灰度变化。
当窗口位于角点时,沿任意方向移动都会有明显的灰度变化。
Harris算法
Harris算法使用微分运算和自相关矩阵来进行角点检测,具有运算简单、提取的角点特征均匀合理、性能稳定等特点。
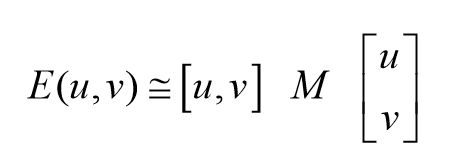
假设图像像素点(x,y)的灰度为 I(x,y),以像素点为中心的窗口沿 x 和 y 方向分别移动 u 和 v 的灰度强度变化的表达式为:

其中 E(u,v)是灰度变化,w(x,y) 是窗口函数,一般是高斯函数,所以可以把w(x,y)看做是高斯滤波器。I(x,y)是图像灰度, I(x+u,y+v)是平移后的图像灰度。
收到泰勒公式的启发,在这里我们可以将 I(x+u,y+v)函数在(x,y)处泰勒展开,为了提高抗干扰的能力并且简化运算,我们取到了一阶导数部分,后面的无穷小小量O(u2+v2)可以忽略,整理得到表达式如下:
展开后变型可以近似得到E(x,y)的表达式

记M得特征值为λ1,λ2

如图进行分类

det M是矩阵M的行列式,Trace(M)为矩阵M的迹。k为修正值,是一个常数,经验取值为0.04-0.06。算出响应值之后,根据R与阈值T的比较来判断是否为角点。
当|R|很小时,R<T , 认为该点处于图像的平坦区域。
当R<0时,R<T , 认为该点处于图像的边缘区。
当R>0时,R>T, 认为该点位置就是图像角点。
1.2代码
from PIL import Image
from pylab import *
from scipy.ndimage import filters


def compute_harris_response(im, sigma=3):
    """在一幅灰度图像中,对每个像素计算Harris角点检测器响应函数"""

    # 计算导数
    imx = zeros(im.shape)
    filters.gaussian_filter(im, (sigma, sigma), (0,1), imx)
    imy = zeros(im.shape)
    filters.gaussian_filter(im, (sigma, sigma), (1,0), imy)

    # 计算Harris矩阵的分量
    Wxx = filters.gaussian_filter(imx*imx, sigma)
    Wxy = filters.gaussian_filter(imx*imy, sigma)
    Wyy = filters.gaussian_filter(imy*imy, sigma)

    # 计算特征值和迹
    Wdet = Wxx * Wyy - Wxy**2
    Wtr = Wxx + Wyy

    return Wdet / Wtr

def get_harris_points(harrisim, min_dist=10, threshold=0.1):
    """从一幅Harris响应图像中返回角点。min_dist为分割角点和图像边界的最小像素数目"""


    # 寻找高于阈值的候选角点
    corner_threshold = harrisim.max() * threshold
    harrisim_t = (harrisim > corner_threshold) * 1


    # 得到候选点的坐标
    coords = array(harrisim_t.nonzero()).T


    # 以及它们的Harris响应值
    candidate_values = [harrisim[c[0], c[1]] for c in coords]


    # 对候选点按照Harris响应值进行排序
    index = argsort(candidate_values)

    # 将可行点的位置保存到数组中
    allowed_locations = zeros(harrisim.shape)
    allowed_locations[min_dist:-min_dist,min_dist:-min_dist] = 1

    # 按照min_distance原则,选择最佳Harris点
    filtered_coords = []
    for i in index:
        if allowed_locations[coords[i,0], coords[i,1]] == 1:
            filtered_coords.append(coords[i])
            allowed_locations[(coords[i,0]-min_dist):(coords[i,0]+min_dist),
            (coords[i,1]-min_dist):(coords[i,1]+min_dist)] = 0

    return filtered_coords


def get_harris_points(harrisim, min_dist=10, threshold=0.1):

    # 寻找高于阈值的候选角点
    corner_threshold = harrisim.max() * threshold
    # print(corner_threshold)

    harrisim_t = (harrisim > corner_threshold) * 1
    # plt.imshow(harrisim_t, plt.cm.gray)

    # 得到候选点的坐标(取出是角点的坐标)
    coords = array(harrisim_t.nonzero()).T
    # print(coords.shape)

    # 以及它们的Harris响应值
    candidate_values = [harrisim[c[0], c[1]] for c in coords]

    # 对候选点按照Harris响应值进行排序
    index = argsort(candidate_values)

    # 将可行点的位置保存到数组中
    allowed_location = zeros(harrisim.shape)
    # 相当于把外面一圈有响应值的点先舍去(匹配主体在中心)
    allowed_location[min_dist:-min_dist, min_dist:-min_dist] = 1

    # 按照min_distance原则,选择最佳的Harris角点
    filtered_coords = []
    for i in index:
        if allowed_location[coords[i, 0], coords[i, 1]] == 1:
            filtered_coords.append(coords[i])
            allowed_location[(coords[i, 0] - min_dist):(coords[i, 0] + min_dist),
                             (coords[i, 1] - min_dist):(coords[i, 1] + min_dist)] = 0

    return filtered_coords

# 绘制图像中检测到的角点


def plot_harris_points(image, filtered_coords):
    """绘制图像中检测到的角点"""

    figure()
    gray()
    imshow(image)
    plot([p[1] for p in filtered_coords], [p[0] for p in filtered_coords], '*')
    axis('off')
    show()
'''

if "__main__" == __name__:
    # 打开灰度图convert('L')
    im = array(Image.open('./screen/2/6.png').convert('L'))
    harrisim = compute_harris_response(im)
    filtered_coords = get_harris_points(harrisim, 6)
    plot_harris_points(im, filtered_coords)
'''


def get_descriptors(image, filtered_coords, wid=5):
    """返回点周围2*wid+1个像素的值"""
    desc = []
    for coords in filtered_coords:
        patch = image[coords[0] - wid:coords[0] + wid + 1,
                      coords[1] - wid:coords[1] + wid + 1].flatten()
        desc.append(patch)
    return desc


def match(desc1, desc2, threshold=0.5):
    """归一化互相关"""
    n = len(desc1[0])
    d = -ones((len(desc1), len(desc2)))

    #点对的距离
    for i in range(len(desc1)):
        for j in range(len(desc2)):
            d1 = (desc1[i] - mean(desc1[i])) / std(desc1[i])
            d2 = (desc2[j] - mean(desc2[j])) / std(desc2[j])
            ncc_value = sum(d1 * d2) / (n-1)
            if ncc_value > threshold:
                d[i, j] = ncc_value

    ndx = argsort(-d)
    matchscores = ndx[:, 0]
    return matchscores


def match_twosided(desc1, desc2, threshold=0.5):
    """两边对称版本的match"""
    matches_12 = match(desc1, desc2, threshold)
    matches_21 = match(desc2, desc1, threshold)

    ndx_12 = where(matches_12 >= 0)[0]

    # 去除非对称的匹配
    for n in ndx_12:
        if matches_21[matches_12[n]] != n:
            matches_12[n] = -1

    return matches_12


def appendimages(img1, img2):
    """返回两幅图像并拼接成一幅新图像"""
    rows1 = img1.shape[0]
    rows2 = img2.shape[0]

    if rows1 < rows2:
        img1 = concatenate(
            (img1, zeros((rows2 - rows1, img1.shape[1]))), axis=0)
    elif rows1 > rows2:
        img2 = concatenate(
            (img2, zeros((rows1 - rows2, img2.shape[1]))), axis=0)

    return concatenate((img1, img2), axis=1)


def plot_matches(img1, img2, locs1, locs2, matchscores, show_below=True):
    """显示一幅带有连接匹配之间连线的图片"""
    img3 = appendimages(img1, img2)
    if show_below:
        img3 = vstack((img3, img3))

    imshow(img3)

    cols1 = img1.shape[1]
    for i, m in enumerate(matchscores):
        if m > 0:
            plot([locs1[i][1], locs2[m][1] + cols1],
                 [locs1[i][0], locs2[m][0]], 'c')
    axis('off')

if "__main__" == __name__:
    # 打开灰度图convert('L')
    img1 = array(Image.open('./screen/2/5.png').convert('L'))
    img2 = array(Image.open('./screen/2/6.png').convert('L'))

    wid = 5
    harrisim = compute_harris_response(img1, 5)
    filtered_coords1 = get_harris_points(harrisim, wid + 1)
    d1 = get_descriptors(img1, filtered_coords1, wid)

    harrisim = compute_harris_response(img2, 5)
    filtered_coords2 = get_harris_points(harrisim, wid + 1)
    d2 = get_descriptors(img2, filtered_coords2, wid)

    print("starting matching")
    matches = match_twosided(d1, d2)

    figure()
    gray()
    plot_matches(img1, img2, filtered_coords1, filtered_coords2, matches)
    show()
3 实验结果
原图


结果:
2 SIFT特征
2.3实验结果


