图像局部描述符:SIFT描述子与Harris角点检测
引言
Harris角点检测算法是最简单的角点检测方法之一,因此也存在不少弊端。随着科研人员不断的研究提出了SIFT方法,在原先的基础能够更好地进行图像特征描述,能够更加准确的对描述子进行匹配。但是若想达到最理想状态下的图像特征匹配,仅靠SIFT算法还是不够的。我们仍需要通过不断的科学研究优化与创新算法,最终达到更高效、更准确的图像特征点匹配。
一、角点检测
首先我们来看Harris角点检测,通过Harris角点检测器可以给出图像中检测到兴趣点,其代码与结果如下所示:
from pylab import *
from PIL import Image
from PCV.localdescriptors import harris

# 读入图像
im = array(Image.open(r'C:\Users\18042\Desktop\img1.jpg').convert('L'))

# 检测harris角点
harrisim = harris.compute_harris_response(im)

# Harris响应函数
harrisim1 = 255 - harrisim

figure()
gray()

#画出Harris响应图
subplot(121)
imshow(im)
axis('off')
axis('equal')

threshold = [0.01, 0.05, 0.1]
for i, thres in enumerate(threshold):
    filtered_coords = harris.get_harris_points(harrisim, 6, thres)

subplot(1, 2, 2)
imshow(im)
print (im.shape)
plot([p[1] for p in filtered_coords], [p[0] for p in filtered_coords], '*')
axis('off')

show()
原图像:img1.jpg

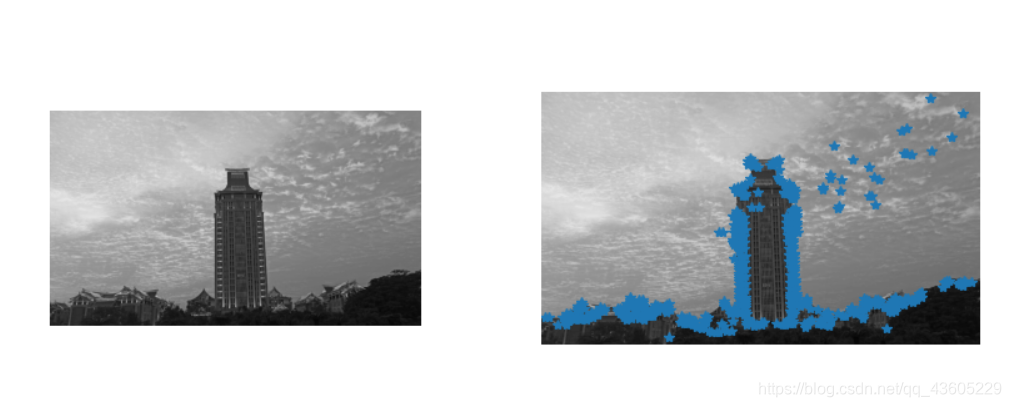
单从检查结果来看似乎还不错,基本实现了大部分角点的识别。但如果我们将该结果与SIFT特征进行对比可以看出Harris角点检测还是略逊与SIFT:
# -*- coding: utf-8 -*-
from PIL import Image
from pylab import *
from PCV.localdescriptors import sift
from PCV.localdescriptors import harris

# 添加中文字体支持
from matplotlib.font_manager import FontProperties
font = FontProperties(fname=r"c:\windows\fonts\SimSun.ttc", size=14)

imname = r'C:\Users\18042\Desktop\img1.jpg'
im = array(Image.open(imname).convert('L'))
sift.process_image(imname, 'empire.sift')
l1, d1 = sift.read_features_from_file('empire.sift')

figure()
gray()
subplot(131)
sift.plot_features(im, l1, circle=False)
title(u'SIFT特征',fontproperties=font)
subplot(132)
sift.plot_features(im, l1, circle=True)
title(u'用圆圈表示SIFT特征尺度',fontproperties=font)

# 检测harris角点
harrisim = harris.compute_harris_response(im)

subplot(133)
filtered_coords = harris.get_harris_points(harrisim, 6, 0.1)
imshow(im)
plot([p[1] for p in filtered_coords], [p[0] for p in filtered_coords], '*')
axis('off')
title(u'Harris角点',fontproperties=font)

show()
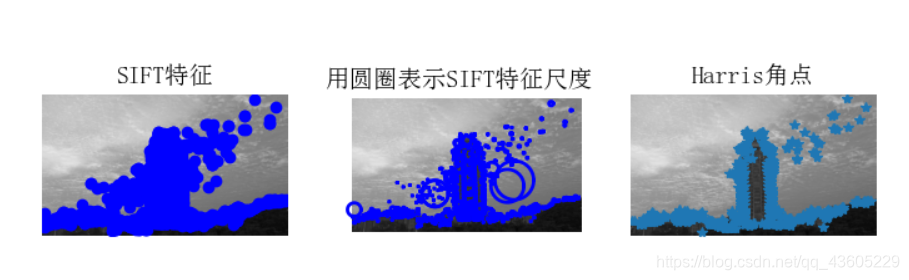
结果分析
从结果中我们可以明显的看出SIFT特征的识别要强于Harris角点,例如图中建筑物中部的轮廓SIFT能够很好的识别而Harris脚点却无法识别。这正是由于算法的原理不同而导致了结果的不同,Harris脚点检测主要以如下图所示三种情况下Harris矩阵的特征值为依据进行脚点的检测,在一定区域内像素差别不大的情况下不能够很好的进行脚点检测; 而SIFT特征通过在不同的尺度空间中寻找极值点(特征点,关键点)的精确定位和主方向,构建关键点描述符来提取特征。在不同尺度空间的变换很好地解决了小区域的识别不清问题。

二、特征点匹配
首先我们来看通过harris脚点进行匹配的结果:
from pylab import *
from PIL import Image

from PCV.localdescriptors import harris
from PCV.tools.imtools import imresize

im1 = array(Image.open(r'C:\Users\18042\Desktop\img1.jpg').convert("L"))
im2 = array(Image.open(r'C:\Users\18042\Desktop\img2.jpg').convert("L"))

im1 = imresize(im1, (im1.shape[1], im1.shape[0]))
im2 = imresize(im2, (im2.shape[1], im2.shape[0]))

wid = 5
harrisim = harris.compute_harris_response(im1, 5)
filtered_coords1 = harris.get_harris_points(harrisim, wid+1)
d1 = harris.get_descriptors(im1, filtered_coords1, wid)

harrisim = harris.compute_harris_response(im2, 5)
filtered_coords2 = harris.get_harris_points(harrisim, wid+1)
d2 = harris.get_descriptors(im2, filtered_coords2, wid)

print ('starting matching')
matches = harris.match_twosided(d1, d2)

figure()
gray()
harris.plot_matches(im1, im2, filtered_coords1, filtered_coords2, matches)
show()

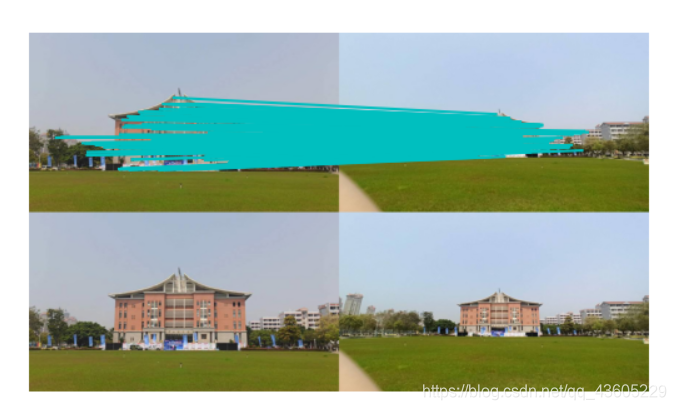
Harris结果分析
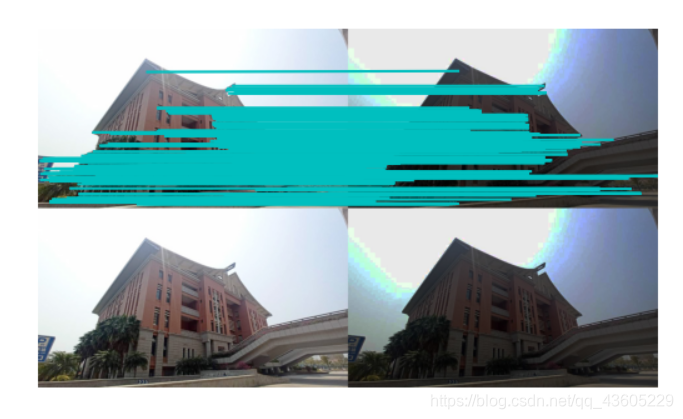
在这里我们给出的是两张相近的图片,只是与稍往右移拍摄的一张图片继续匹配,图中有多数点都能进行匹配,但是我们会发现有一些点出现的错配,例如图中在上方云层中的点却与下方的点产生了匹配。如果改变一下图片,对两张完全不是一个场景的图片进行匹配,那我们会发现事情的严重性,如下图:

两张毫不相干的图片在Harris脚点匹配中竟然会有如此之多的匹配值,看来Harris算法还是八太行啊,反之来看SIFT:
from PIL import Image
from pylab import *
import sys
from PCV.localdescriptors import sift


if len(sys.argv) >= 3:
  im1f, im2f = sys.argv[1], sys.argv[2]
else:
  im1f = r'C:\Users\18042\Desktop\img1.jpg'
  im2f = r'C:\Users\18042\Desktop\img2.jpg'
im1 = array(Image.open(im1f))
im2 = array(Image.open(im2f))

sift.process_image(im1f, 'out_sift_1.txt')
l1, d1 = sift.read_features_from_file('out_sift_1.txt')
figure()
gray()
subplot(121)
sift.plot_features(im1, l1, circle=False)

sift.process_image(im2f, 'out_sift_2.txt')
l2, d2 = sift.read_features_from_file('out_sift_2.txt')
subplot(122)
sift.plot_features(im2, l2, circle=False)

#matches = sift.match(d1, d2)
matches = sift.match_twosided(d1, d2)
print ('{} matches'.format(len(matches.nonzero()[0])))

figure()
gray()
sift.plot_matches(im1, im2, l1, l2, matches, show_below=True)
show()

SIFT结果分析
我们可以看到在对于相近的图片时几乎没有出现错配的点,只有极少数建筑物上重复出现的特征才出现了错配,这是不可避免的。

而对于这样豪不相干的图片SIFT也不会像Harris那样出现一大堆莫名的匹配点。
同时,由于SIFT的特色,通过在不同的尺度空间中寻找极值点(特征点,关键点)的精确定位和主方向,构建关键点描述符来提取特征。SIFT提取的关键点具有尺度不变性、旋转不变性,且在亮度差异较大的情况也能够很好的进行特征匹配,这是Harris角间检测所无法媲美的。如下图:
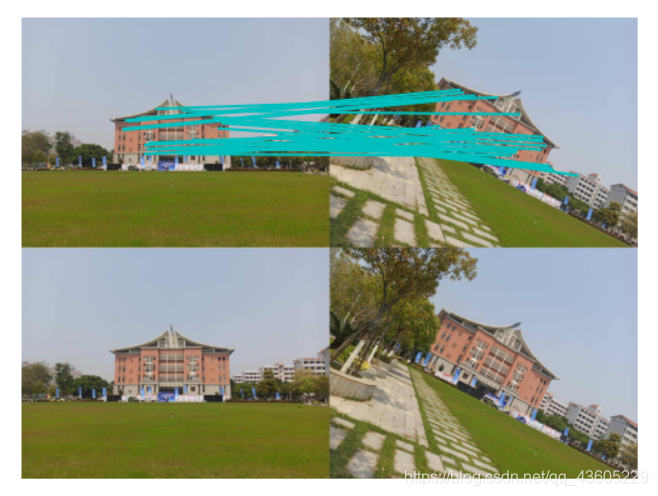

如上图所示我们可以很直接的看到SIFT的特性,对图片旋转亮度角度与尺度有很好的敏感度。但是同时我在测试过程中也发现了一些问题
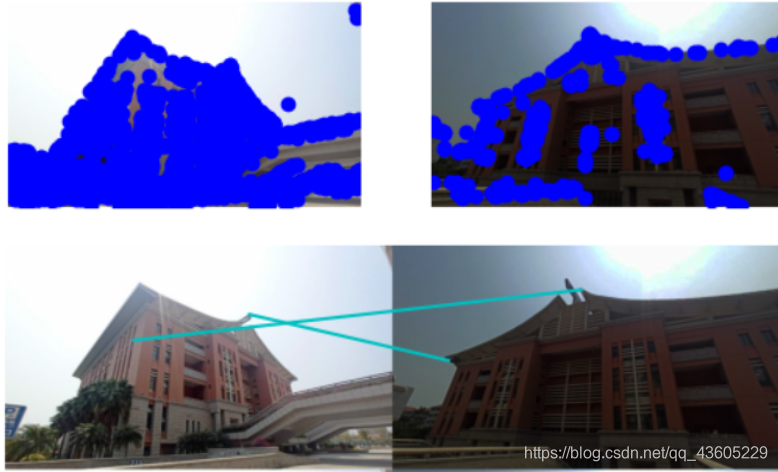

如图所示,对从不同拍摄角度的图片进行SIFT特征匹配的结果极差,只有很少的特征点能够匹配成功,甚至无一特征点能够成功匹配。虽然SIFT对二维的图片旋转能够很好地进行匹配,但是通过不同角度拍摄得到的图片经过三维旋转并不能够准确的进行匹配。因此,虽然SIFT相较于Harris角点检测更优,但仍存在问题,还能够对算法进行优化从而得到更加精确与强大的特征点匹配算法!
三、地理标记图像匹配
# -*- coding: utf-8 -*-
import json
import os
import urllib
from pylab import *
from PIL import Image
from PCV.localdescriptors import sift
from PCV.tools import imtools
import pydot
import os
os.environ["PATH"] += os.pathsep + 'D:/Graphviz/bin'

if __name__ == '__main__':
    download_path = r"C:\Users\18042\Desktop\32Vision\img"
    path = r"C:\Users\18042\Desktop\32Vision\img"

    imlist = imtools.get_imlist(download_path)
    nbr_images = len(imlist)

    featlist = [imname[:-3] + 'sift' for imname in imlist]
    for i, imname in enumerate(imlist):
        sift.process_image(imname, featlist[i])

    matchscores = zeros((nbr_images, nbr_images))

    for i in range(nbr_images):
        for j in range(i, nbr_images):  # only compute upper triangle
            print('comparing ', imlist[i], imlist[j])
            l1, d1 = sift.read_features_from_file(featlist[i])
            l2, d2 = sift.read_features_from_file(featlist[j])
            matches = sift.match_twosided(d1, d2)
            nbr_matches = sum(matches > 0)
            print('number of matches = ', nbr_matches)
            matchscores[i, j] = nbr_matches

    # copy values
    for i in range(nbr_images):
        for j in range(i + 1, nbr_images):  # no need to copy diagonal
            matchscores[j, i] = matchscores[i, j]

    # 可视化
    threshold = 2  # min number of matches needed to create link

    g = pydot.Dot(graph_type='graph')  # don't want the default directed graph

    for i in range(nbr_images):
        for j in range(i + 1, nbr_images):
            if matchscores[i, j] > threshold:
                # first image in pair
                im = Image.open(imlist[i])
                im.thumbnail((100, 100))
                filename = path + str(i) + '.jpg'
                im.save(filename)  # need temporary files of the right size
                g.add_node(pydot.Node(str(i), fontcolor='transparent', shape='rectangle', image=filename))

                # second image in pair
                im = Image.open(imlist[j])
                im.thumbnail((100, 100))
                filename = path + str(j) + '.jpg'
                im.save(filename)  # need temporary files of the right size
                g.add_node(pydot.Node(str(j), fontcolor='transparent', shape='rectangle', image=filename))

                g.add_edge(pydot.Edge(str(i), str(j)))
    g.write_jpg('outimg.jpg')
