运行结果:
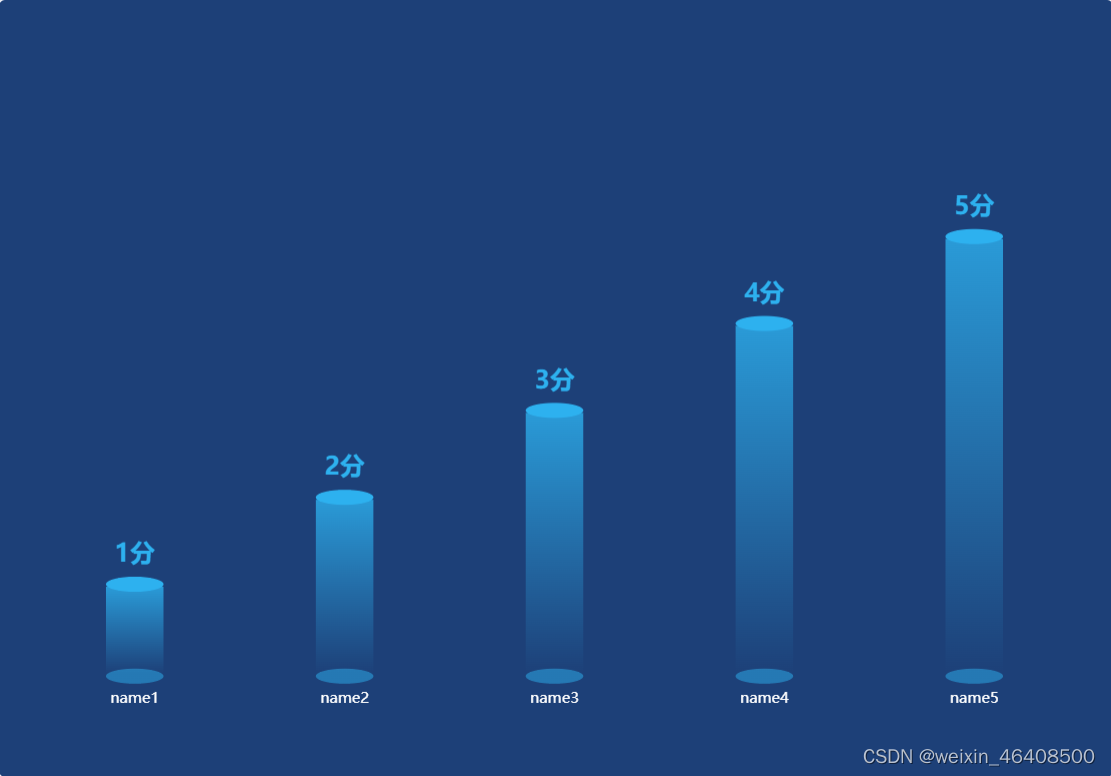
option配置项:
option = {
  backgroundColor: '#1d4078', // 背景色  rgba设置透明度0.1
  tooltip: {
    //鼠标悬浮提示
    trigger: 'item',
    axisPointer: {
      type: 'shadow'
    },
    formatter: '{b}:{c}分', //显示的内容
    backgroundColor: 'rgba(21, 45, 85, 0.6)', //背景颜色(此时为默认色)
    textStyle: {
      color: '#fff'
    }
  },
  grid: {
    //图例位置
    left: '0%',
    right: '2%',
    top: '30%',
    bottom: '8%',
    containLabel: true
  },
  xAxis: [
    {
      type: 'category',
      data: [
        'name1',
        'name2',
        'name3',
        'name4',
        'name5'
      ],
      axisTick: {
        alignWithLabel: true
      },
      axisLine: {
        show: false //隐藏y轴
      },
      axisTick: {
        show: false //刻度线
      },
      // x轴的字体样式
      axisLabel: {
        show: true,
        margin: 14, //边距
        textStyle: {
          color: '#fff',
          fontSize: '12',
          fontWeight: '400',
          fontFamily: 'Microsoft YaHei'
        },
        interval: 0 //x轴文字不隐藏
      }
    }
  ],
  yAxis: [
    {
      type: 'value',
      show: false,
      // 取消坐标线
      splitLine: {
        show: false
      },
      axisLine: {
        show: false //隐藏y轴
      },
      axisTick: {
        show: false //刻度线
      }
    }
  ],
  series: [
    {
      name: '底部截面',
      type: 'pictorialBar', //pictorialBar 象形柱图
      symbolSize: [46, 12], //调整截面形状
      symbolOffset: [0, 8],
      z: 12,
      itemStyle: {
        normal: {
          color: new echarts.graphic.LinearGradient(0, 0, 0, 1, [
            {
              offset: 0,
              color: 'rgba(45, 177, 239, 0.5)'
            },
            {
              offset: 1,
              color: 'rgba(45, 177, 239, 0.5)'
            }
          ])
        }
      },
      // 实现数字展示在柱状图
      label: {
        show: true,
        position: 'top',
        fontSize: 20,
        color: '#2DB1EF',
        fontWeight: 'bold',
        offset: [0, -10],
        formatter: '{c}分' //添加单位
      },
      data: [1,2,3,4,5]
    },
    {
      name: '圆柱部分',
      type: 'bar', //bar 柱状图
      barWidth: 46,
      barGap: '0%',
      itemStyle: {
        //柱状样式
        normal: {
          color: {
            x: 0,
            y: 0,
            x2: 0,
            y2: 1,
            type: 'linear',
            global: false,
            colorStops: [
              {
                //第一节下面
                offset: 0,
                color: 'rgba(45, 177, 239, 0.8)'
              },
              {
                offset: 1,
                color: 'rgba(45, 177, 239, 0)'
              }
            ]
          }
        }
      },
      data: [1,2,3,4,5]
    },
    {
      name: '顶部截面',
      type: 'pictorialBar', //pictorialBar 象形柱图
      symbolSize: [46, 12], //调整截面形状
      symbolOffset: [0, -8],
      z: 12,
      symbolPosition: 'end', //图形的位置 'start':图形边缘与柱子开始的地方内切。'end':图形边缘与柱子结束的地方内切。'center':图形在柱子里居中。
      itemStyle: {
        normal: {
          color: new echarts.graphic.LinearGradient(
            0,
            0,
            0,
            1,
            [
              {
                offset: 0,
                color: '#2DB1EF'
              },
              {
                offset: 1,
                color: '#2DB1EF'
              }
            ],
            false
          )
        }
      },
      data: [1,2,3,4,5]
    }
  ]
};