JMH简介
JMH(Java Microbenchmark Harness)由 OpenJDK/Oracle 里面那群开发了 Java编译器的大牛们所开发,是一个功能强大、灵活的工具,它可以用于检测和评估Java应用程序的性能,主要目的是测量Java应用程序的性能,尤其是在多线程环境下的性能。它使用自动生成的测试用例,来测量应用程序的性能,而不是简单的测量方法的性能。
为什么说是微基准测试工具(Micro Benchmark) 呢?
因为是使用在method 层面上,精度可以精确到微秒级。
应用场景:
1、想准确地知道某个方法需要执行多长时间,以及执行时间和输入之间的相关性
2、对比一个函数不同实现在给定条件下的吞吐量(例如 List接口有ArrayList和LinkedList实现),不知道哪种实现性能更好
3、对热点函数进行进一步的优化时,可以使用 JMH 对优化的效果进行定量的分析
快速使用
依赖:
<dependency>
      <groupId>org.openjdk.jmh</groupId>
      <artifactId>jmh-core</artifactId>
      <version>1.27</version>
  </dependency>

<dependency>
    <groupId>org.openjdk.jmh</groupId>
    <artifactId>jmh-generator-annprocess</artifactId>
    <version>1.27</version>
</dependency>
编写基准测试
测试String+ 和 StringBuilder.append() 两种字符串拼接哪个耗时更短,具体代码如下所示:
import org.openjdk.jmh.annotations.*;
import org.openjdk.jmh.runner.*;
import org.openjdk.jmh.runner.options.Options;
import org.openjdk.jmh.runner.options.OptionsBuilder;

import java.util.concurrent.TimeUnit;

@BenchmarkMode(Mode.Throughput)
@Warmup(iterations = 3)
@Measurement(iterations = 10, time = 5, timeUnit = TimeUnit.SECONDS)
@Threads(8)
@Fork(2)
@OutputTimeUnit(TimeUnit.MILLISECONDS)
public class TestStringBenchmark {


    @Benchmark
    public void string() {


        String s = "";
        for (int i = 0; i < 10; i++) {


            s += i;
        }
    }

    @Benchmark
    public void stringBuilder() {


        StringBuilder sb = new StringBuilder();
        for (int i = 0; i < 10; i++) {


            sb.append(i);
        }
    }

    public static void main(String[] args) throws RunnerException {


        Options options = new OptionsBuilder()
            .include(TestStringBenchmark.class.getSimpleName())
            .output("D:/benchmark.log")
            .result("D:/jmh_result.json")
            .resultFormat(ResultFormatType.JSON)
            .build();
        new Runner(options).run();
    }

}
TestStringBenchmark
# JMH version: 1.27
# VM version: JDK 1.8.0_91, Java HotSpot(TM) 64-Bit Server VM, 25.91-b15
# VM invoker: F:\Java\jdk1.8.0_91\jre\bin\java.exe
# VM options: -Dvisualvm.id=1830274449076800 -javaagent:F:\IntelliJ IDEA 2021.1.2\lib\idea_rt.jar=54701:F:\IntelliJ IDEA 2021.1.2\bin -Dfile.encoding=UTF-8
# JMH blackhole mode: full blackhole + dont-inline hint
# Warmup: 3 iterations, 10 s each
# Measurement: 10 iterations, 5 s each
# Timeout: 10 min per iteration
# Threads: 8 threads, will synchronize iterations
# Benchmark mode: Throughput, ops/time
# Benchmark: TestStringBenchmark.string

# Run progress: 0.00% complete, ETA 00:05:20
# Fork: 1 of 2
# Warmup Iteration   1: 11945.156 ops/ms
# Warmup Iteration   2: 15712.330 ops/ms
# Warmup Iteration   3: 14511.393 ops/ms
Iteration   1: 14799.601 ops/ms
Iteration   2: 14200.953 ops/ms
Iteration   3: 15198.794 ops/ms
Iteration   4: 14358.358 ops/ms
Iteration   5: 14782.530 ops/ms
Iteration   6: 14986.920 ops/ms
Iteration   7: 15457.126 ops/ms
Iteration   8: 14530.070 ops/ms
Iteration   9: 14836.293 ops/ms
Iteration  10: 14289.823 ops/ms

# Run progress: 25.00% complete, ETA 00:04:12
# Fork: 2 of 2
# Warmup Iteration   1: 13425.736 ops/ms
# Warmup Iteration   2: 14322.458 ops/ms
# Warmup Iteration   3: 15806.225 ops/ms
Iteration   1: 16404.253 ops/ms
Iteration   2: 16489.533 ops/ms
Iteration   3: 15394.679 ops/ms
Iteration   4: 16249.505 ops/ms
Iteration   5: 16780.925 ops/ms
Iteration   6: 16232.516 ops/ms
Iteration   7: 15428.030 ops/ms
Iteration   8: 15868.765 ops/ms
Iteration   9: 15610.369 ops/ms
Iteration  10: 15852.798 ops/ms


Result "TestStringBenchmark.string":
  15387.592 ±(99.9%) 683.453 ops/ms [Average]
  (min, avg, max) = (14200.953, 15387.592, 16780.925), stdev = 787.065
  CI (99.9%): [14704.139, 16071.045] (assumes normal distribution)


# JMH version: 1.27
# VM version: JDK 1.8.0_91, Java HotSpot(TM) 64-Bit Server VM, 25.91-b15
# VM invoker: F:\Java\jdk1.8.0_91\jre\bin\java.exe
# VM options: -Dvisualvm.id=1830274449076800 -javaagent:F:\IntelliJ IDEA 2021.1.2\lib\idea_rt.jar=54701:F:\IntelliJ IDEA 2021.1.2\bin -Dfile.encoding=UTF-8
# JMH blackhole mode: full blackhole + dont-inline hint
# Warmup: 3 iterations, 10 s each
# Measurement: 10 iterations, 5 s each
# Timeout: 10 min per iteration
# Threads: 8 threads, will synchronize iterations
# Benchmark mode: Throughput, ops/time
# Benchmark: TestStringBenchmark.stringBuilder

# Run progress: 50.00% complete, ETA 00:02:47
# Fork: 1 of 2
# Warmup Iteration   1: 92947.764 ops/ms
# Warmup Iteration   2: 44994.076 ops/ms
# Warmup Iteration   3: 44235.632 ops/ms
Iteration   1: 34708.010 ops/ms
Iteration   2: 33766.341 ops/ms
Iteration   3: 28813.465 ops/ms
Iteration   4: 30891.785 ops/ms
Iteration   5: 38159.050 ops/ms
Iteration   6: 38445.872 ops/ms
Iteration   7: 40228.793 ops/ms
Iteration   8: 43060.997 ops/ms
Iteration   9: 40186.636 ops/ms
Iteration  10: 42147.155 ops/ms

# Run progress: 75.00% complete, ETA 00:01:23
# Fork: 2 of 2
# Warmup Iteration   1: 84987.092 ops/ms
# Warmup Iteration   2: 43920.167 ops/ms
# Warmup Iteration   3: 48326.564 ops/ms
Iteration   1: 44952.072 ops/ms
Iteration   2: 46982.241 ops/ms
Iteration   3: 41305.765 ops/ms
Iteration   4: 44203.234 ops/ms
Iteration   5: 47615.004 ops/ms
Iteration   6: 45715.135 ops/ms
Iteration   7: 47256.792 ops/ms
Iteration   8: 45201.375 ops/ms
Iteration   9: 47769.656 ops/ms
Iteration  10: 48446.133 ops/ms


Result "TestStringBenchmark.stringBuilder":
  41492.776 ±(99.9%) 5059.358 ops/ms [Average]
  (min, avg, max) = (28813.465, 41492.776, 48446.133), stdev = 5826.364
  CI (99.9%): [36433.418, 46552.133] (assumes normal distribution)


# Run complete. Total time: 00:05:34

REMEMBER: The numbers below are just data. To gain reusable insights, you need to follow up on
why the numbers are the way they are. Use profilers (see -prof, -lprof), design factorial
experiments, perform baseline and negative tests that provide experimental control, make sure
the benchmarking environment is safe on JVM/OS/HW level, ask for reviews from the domain experts.
Do not assume the numbers tell you what you want them to tell.

Benchmark                           Mode  Cnt      Score      Error   Units
TestStringBenchmark.string         thrpt   20  15387.592 ±  683.453  ops/ms
TestStringBenchmark.stringBuilder  thrpt   20  41492.776 ± 5059.358  ops/ms

Benchmark result is saved to D:/jmh_result

Process finished with exit code 0
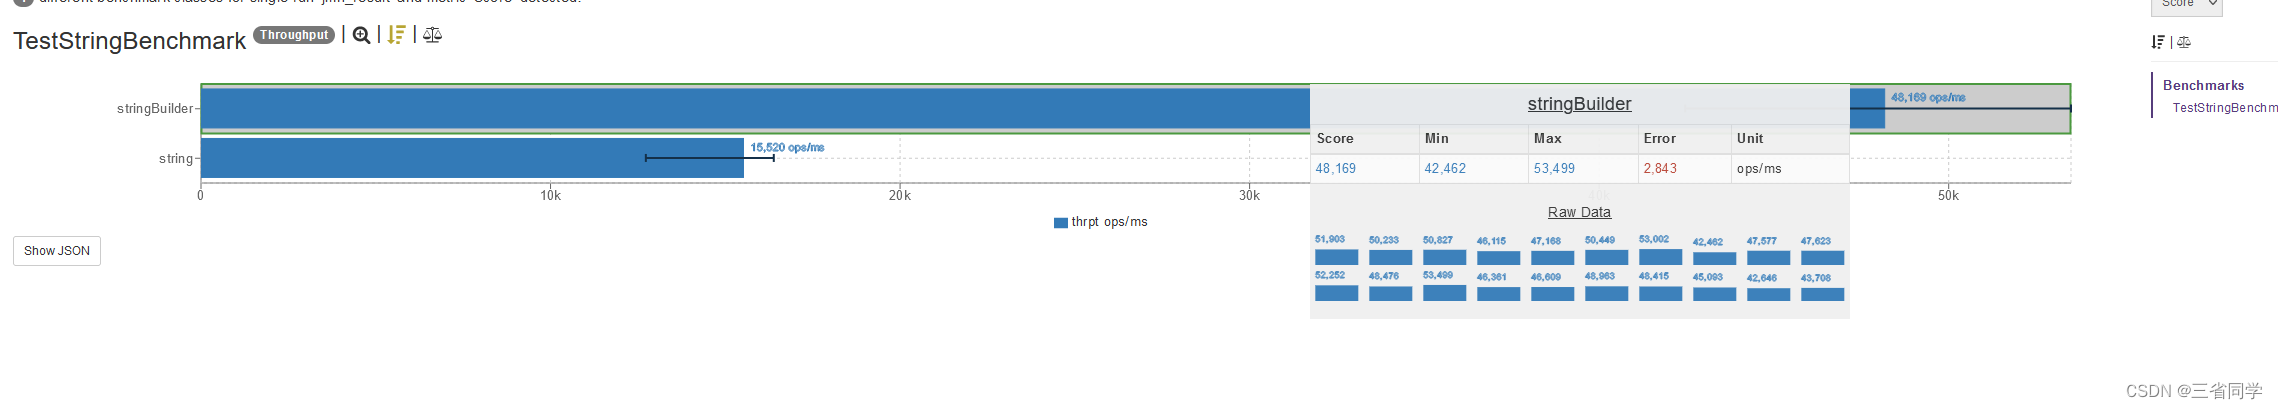
根据测试结果说明,在拼接字符次数越多的情况下,StringBuilder.append() 的性能明显更优秀。
jar 包执行
对于一些小测试,直接用上面的方式写一个 main 函数手动执行就好了。
对于大型的测试,需要测试的时间比较久、线程数比较多,加上测试的服务器需要,一般要放在 Linux 服务器里去执行。
JMH 官方提供了生成 jar 包的方式来执行。
第一步: maven 里增加一个 plugin,具体配置如下:

<plugins>
    <plugin>
        <groupId>org.apache.maven.plugins</groupId>
        <artifactId>maven-shade-plugin</artifactId>
        <version>2.4.1</version>
        <executions>
            <execution>
                <phase>package</phase>
                <goals>
                    <goal>shade</goal>
                </goals>
                <configuration>
                    <finalName>jmh-demo</finalName>
                    <transformers>
                        <transformer
                                implementation="org.apache.maven.plugins.shade.resource.ManifestResourceTransformer">
                            <mainClass>org.openjdk.jmh.Main</mainClass>
                        </transformer>
                    </transformers>
                </configuration>
            </execution>
        </executions>
    </plugin>
</plugins>
或执行
mvn archetype:generate \
         -DinteractiveMode=false \
         -DarchetypeGroupId=org.openjdk.jmh \
         -DarchetypeArtifactId=jmh-java-benchmark-archetype \
         -DgroupId=org.sample \
         -DartifactId=test \
         -Dversion=1.0
第二步:执行 maven 的命令生成可执行 jar 包并执行:
mvn clean install
java -jar target/jmh-demo.jar TestStringBenchmark
IDEA安装JMH 插件
在 IDEA 中点击 File->Settings…->Plugins
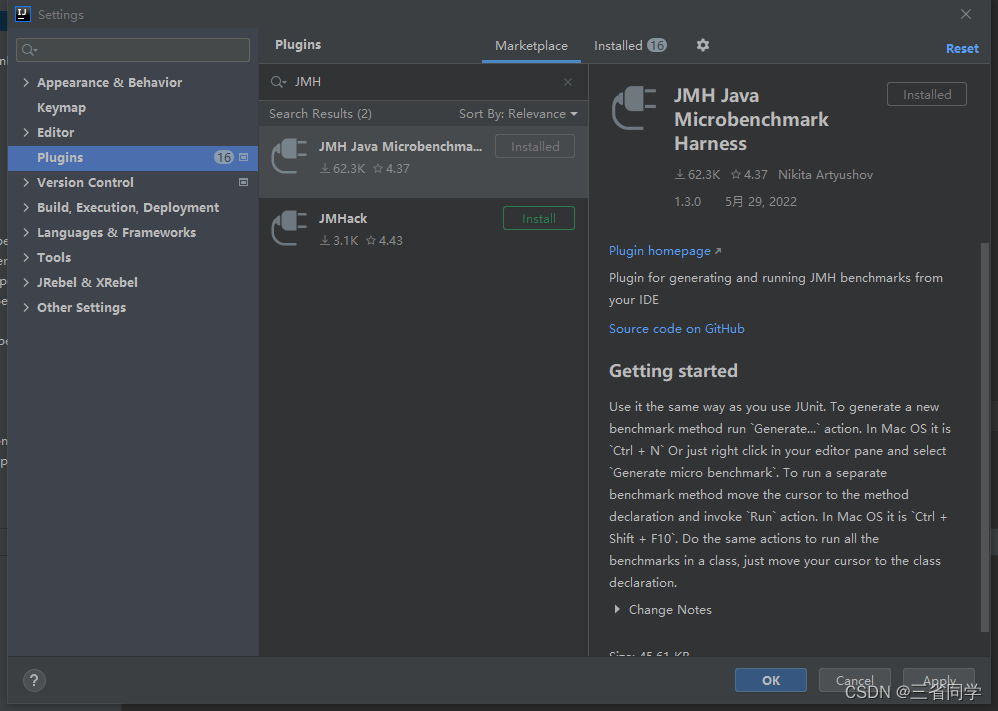
JMH插件与JUnit 有相同的使用方式,主要功能如下:
自动生成带有 @Benchmark 的方法
像 JUnit 一样,运行单独的 Benchmark 方法
运行类中所有的Benchmark 方法
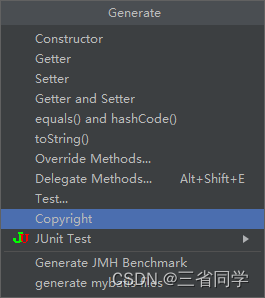
使用右键点击 Generate
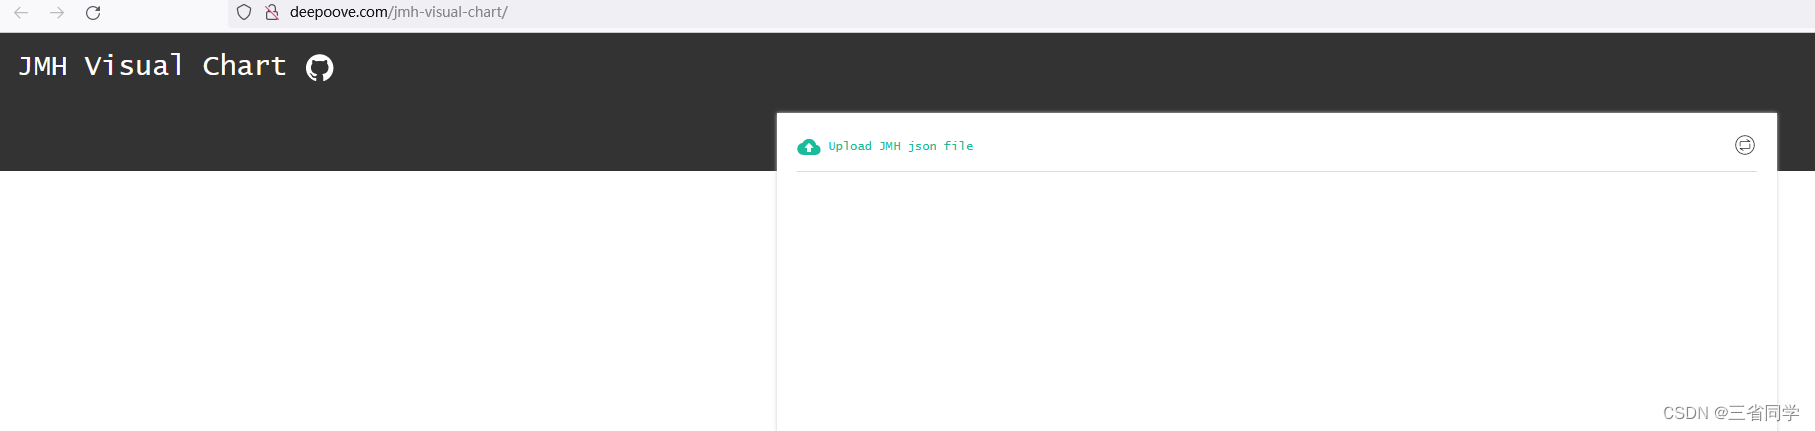
JMH可视化
图形化网站:
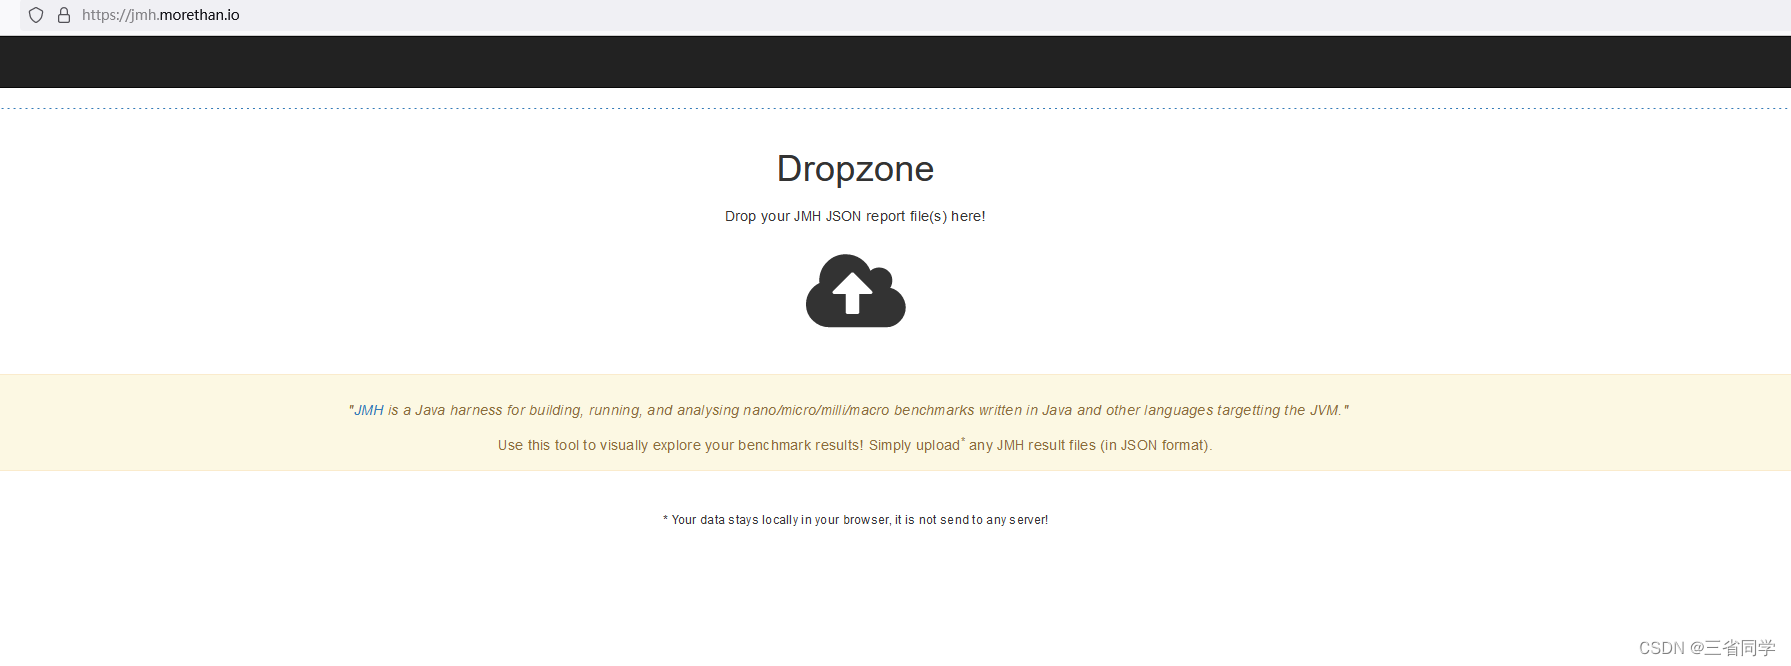
将json 文件导入,就可以实现可视化。
JMH Visual Chart:
JMH Visualizer:
注解
@BenchmarkMode
用来配置 Mode 选项,可用于类或者方法上,这个注解的 value 是一个数组,可以把几种 Mode 集合在一起执行,如:@BenchmarkMode({Mode.SampleTime, Mode.AverageTime}),还可以设置为 Mode.All,即全部执行一遍。
Throughput:整体吞吐量,每秒执行了多少次调用,单位为 ops/time
AverageTime:用的平均时间,每次操作的平均时间,单位为 time/op
SampleTime:随机取样,最后输出取样结果的分布
SingleShotTime:只运行一次,往往同时把 Warmup 次数设为 0,用于测试冷启动时的性能
All:上面的所有模式都执行一次
@State
通过 State 可以指定一个对象的作用范围,JMH 根据 scope 来进行实例化和共享操作。@State 可以被继承使用,如果父类定义了该注解,子类则无需定义。由于 JMH 允许多线程同时执行测试,不同的选项含义如下:
Scope.Benchmark:所有测试线程共享一个实例,测试有状态实例在多线程共享下的性能
Scope.Group:同一个线程在同一个 group 里共享实例
Scope.Thread:默认的 State,每个测试线程分配一个实例
@OutputTimeUnit
为统计结果的时间单位,可用于类或者方法注解
@Warmup
预热所需要配置的一些基本测试参数,可用于类或者方法上。一般前几次进行程序测试的时候都会比较慢,所以要让程序进行几轮预热,保证测试的准确性。参数如下所示:
iterations:预热的次数
time:每次预热的时间
timeUnit:时间的单位,默认秒
batchSize:批处理大小,每次操作调用几次方法
为什么需要预热?
因为 JVM 的 JIT 机制的存在,如果某个函数被调用多次之后,JVM 会尝试将其编译为机器码,从而提高执行速度,所以为了让
benchmark 的结果更加接近真实情况就需要进行预热。
@Measurement
实际调用方法所需要配置的一些基本测试参数,可用于类或者方法上,参数和 @Warmup 相同。
@Threads
每个进程中的测试线程,可用于类或者方法上。
@Fork
进行 fork 的次数,可用于类或者方法上。如果 fork 数是 2 的话,则 JMH 会 fork 出两个进程来进行测试。
@Param
指定某项参数的多种情况,特别适合用来测试一个函数在不同的参数输入的情况下的性能,只能作用在字段上,使用该注解必须定义@State 注解。
小结
JMH是一款强大的Java和JVM性能基准测试工具,它能够准确、灵活地测量各种Java应用程序的性能,并通过可视化界面帮助开发人员快速定位性能瓶颈。有了JMH,开发人员就能够更加精确、有效地调优Java应用程序的性能,从而提高应用程序的效率和稳定性。
参考资料
https://www.oracle.com/technical-resources/articles/java/architect-benchmarking.html
https://github.com/lexburner/JMH-samples
https://www.cnkirito.moe/java-jmh/
https://openjdk.org/projects/code-tools/jmh/