实现用 Echarts 图表库完成一个展示 男女比例 的效果图 :
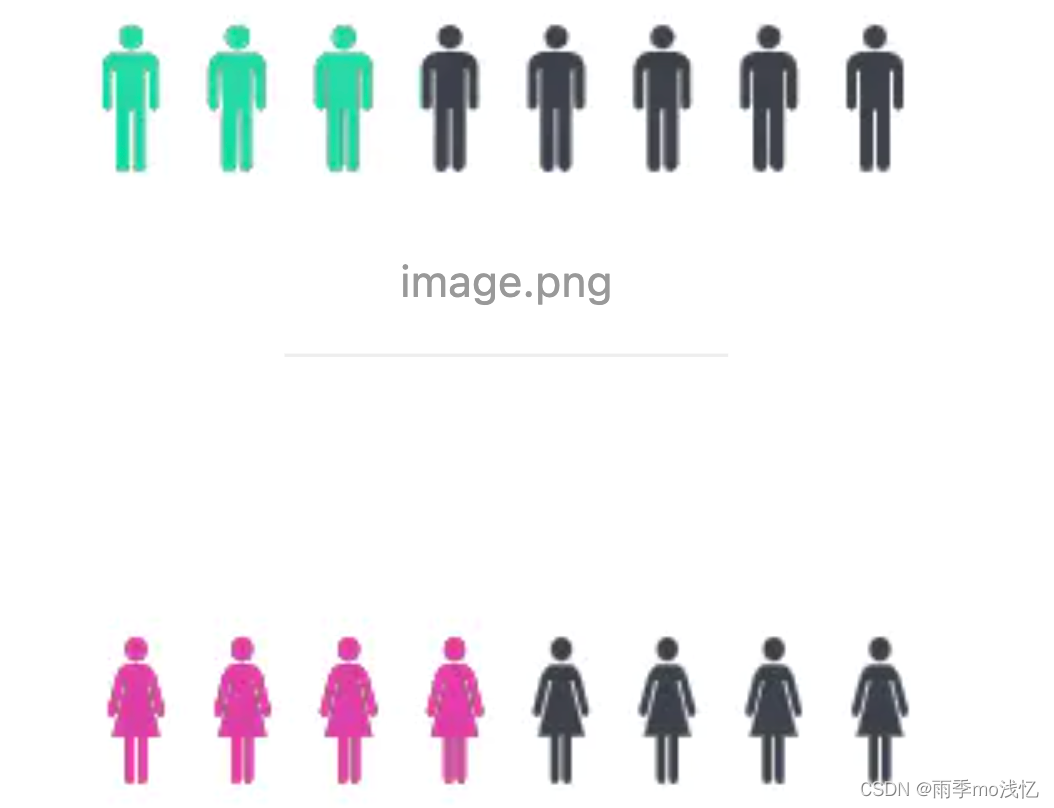
示例 代码如下 :
<!DOCTYPE html>
<html lang="en">
  <head>
    <meta charset="UTF-8" />
    <meta http-equiv="X-UA-Compatible" content="IE=edge" />
    <meta name="viewport" content="width=device-width, initial-scale=1.0" />
    <title>Document</title>
    <style>
      .chart {
        width: 300px;
        height: 200px;
        border: 1px solid red;
      }
    </style>
  </head>
  <body>
    <div class="chart" id="chart"></div>
    <script src="https://cdn.staticfile.org/echarts/4.3.0/echarts.min.js"></script>
    <script>
      // 基于准备好的dom,初始化echarts实例
      var myChart = echarts.init(document.getElementById("chart"));
      var man = `path://M516.608 217.6c40.448 0 72.704-32.768 72.704-72.704 0-40.448-32.768-72.704-72.704-72.704-40.448 0-72.704 32.768-72.704 72.704s32.256 72.704 72.704 72.704z m80.384 18.432H435.712c-51.2 0-93.696 41.472-93.696 93.184v225.28c0 17.408 13.824 31.744 31.232 31.744s31.744-14.336 31.744-31.744V351.744h16.384v565.76c0 23.552 18.944 42.496 43.008 42.496 23.552 0 42.496-18.944 42.496-42.496V588.8h17.408v328.192c0 23.552 18.944 42.496 42.496 42.496 23.552 0 43.008-18.944 43.008-42.496V351.744h16.384v203.264c0 17.408 14.336 31.744 31.744 31.744 17.408 0 31.232-14.336 31.232-31.744v-225.28c1.024-51.712-40.96-93.696-92.16-93.696z`;
      var girl = `path://M693.064905 504.590142l-55.845778-202.954549c-7.532724-22.967796-34.488553-63.372358-79.685923-65.239925h-89.777337c-46.750604 1.927976-73.520086 41.894316-80.000256 65.365863l-55.777177 202.707792c-11.954885 44.266658 39.220951 61.57032 51.857744 19.985218l49.867311-187.020846h14.008799l-85.85176 328.529989h80.247012v246.909946c0 44.697714 60.764522 44.697714 60.764522 0v-246.909946h18.924473v246.909946c0 44.697714 58.766922 44.697714 58.766922 0v-246.909946h82.427888l-87.654823-328.529989h15.938823l49.988129 187.020846c12.331675 42.517862 63.256659 24.280417 51.801431-19.864399zM512.336858 219.833299c38.471467 0 69.538196-32.435663 69.538196-72.527941 0-40.031868-31.066729-72.528965-69.538196-72.528965-38.415154 0-69.48393 32.497096-69.48393 72.528965 0 40.030845 31.0698 72.527941 69.48393 72.527941z`;
      var option1 = {};
      var option2 = {};
      function mans(mannum, max) {
        option1 = {
          color: ["#29D7A8", "#3C404C"],
          tooltip: {
            show: false,
          },
          xAxis: {
            type: "value",
            max: max,
            splitLine: { show: false },
            offset: 10,
            axisLine: {
              show: false,
              lineStyle: {
                color: "#999",
              },
            },
            axisLabel: {
              show: false,
              margin: 10,
            },
          },
          yAxis: {
            type: "category",
            data: ["男"],
            inverse: true,
            axisTick: { show: false },
            axisLine: { show: false },
            axisLabel: {
              show: false,
              margin: 10,
              color: "#999",
              fontSize: 16,
            },
          },

          series: [
            {
              // current data
              type: "pictorialBar",
              symbol: man,
              symbolRepeat: "false",
              symbolMargin: [10, 0],
              symbolClip: true,
              symbolSize: [17, 44],
              symbolBoundingData: max,
              data: [mannum],
              z: 10,
            },
            {
              type: "pictorialBar",
              label: {
                show: false,
              },
              animationDuration: 0,
              symbolRepeat: "fixed",
              symbolMargin: [10, 0],
              symbol: man,
              symbolSize: [17, 44],
              symbolBoundingData: max,
              data: [max],
              z: 5,
            },
          ],
        };
      }

      function wonman(girlnum,max) {
        option2 = {
          color: ["#E03DA4", "#3C404C"],
          tooltip: {
            show: false,
          },
          xAxis: {
            type: "value",
            max: max,
            splitLine: { show: false },
            offset: 10,
            axisLine: {
              show: false,
              lineStyle: {
                color: "#999",
              },
            },
            axisLabel: {
              show: false,
              margin: 10,
            },
          },
          yAxis: {
            type: "category",
            data: ["女"],
            inverse: true,
            axisTick: { show: false },
            axisLine: { show: false },
            axisLabel: {
              show: false,
              margin: 10,
              color: "#999",
              fontSize: 16,
            },
          },

          series: [
            {
              // current data
              type: "pictorialBar",
              symbol: girl,
              symbolRepeat: "false",
              symbolMargin: [10, 0],
              symbolClip: true,
              symbolSize: [17, 44],
              symbolBoundingData: max,
              data: [girlnum],
              z: 10,
            },
            {
              type: "pictorialBar",
              itemStyle: {
                normal: {},
              },
              label: {
                show: false,
              },
              animationDuration: 0,
              symbolRepeat: "fixed",
              symbolMargin: [10, 0],
              symbol: girl,
              symbolSize: [17, 44],
              symbolBoundingData: max,
              data: [max],
              z: 5,
            },
          ],
        };
      }

      mans(4, 10);
      wonman(5,10)
      myChart.setOption(option2);
    </script>
  </body>
</html>
真实项目使用 案例 :
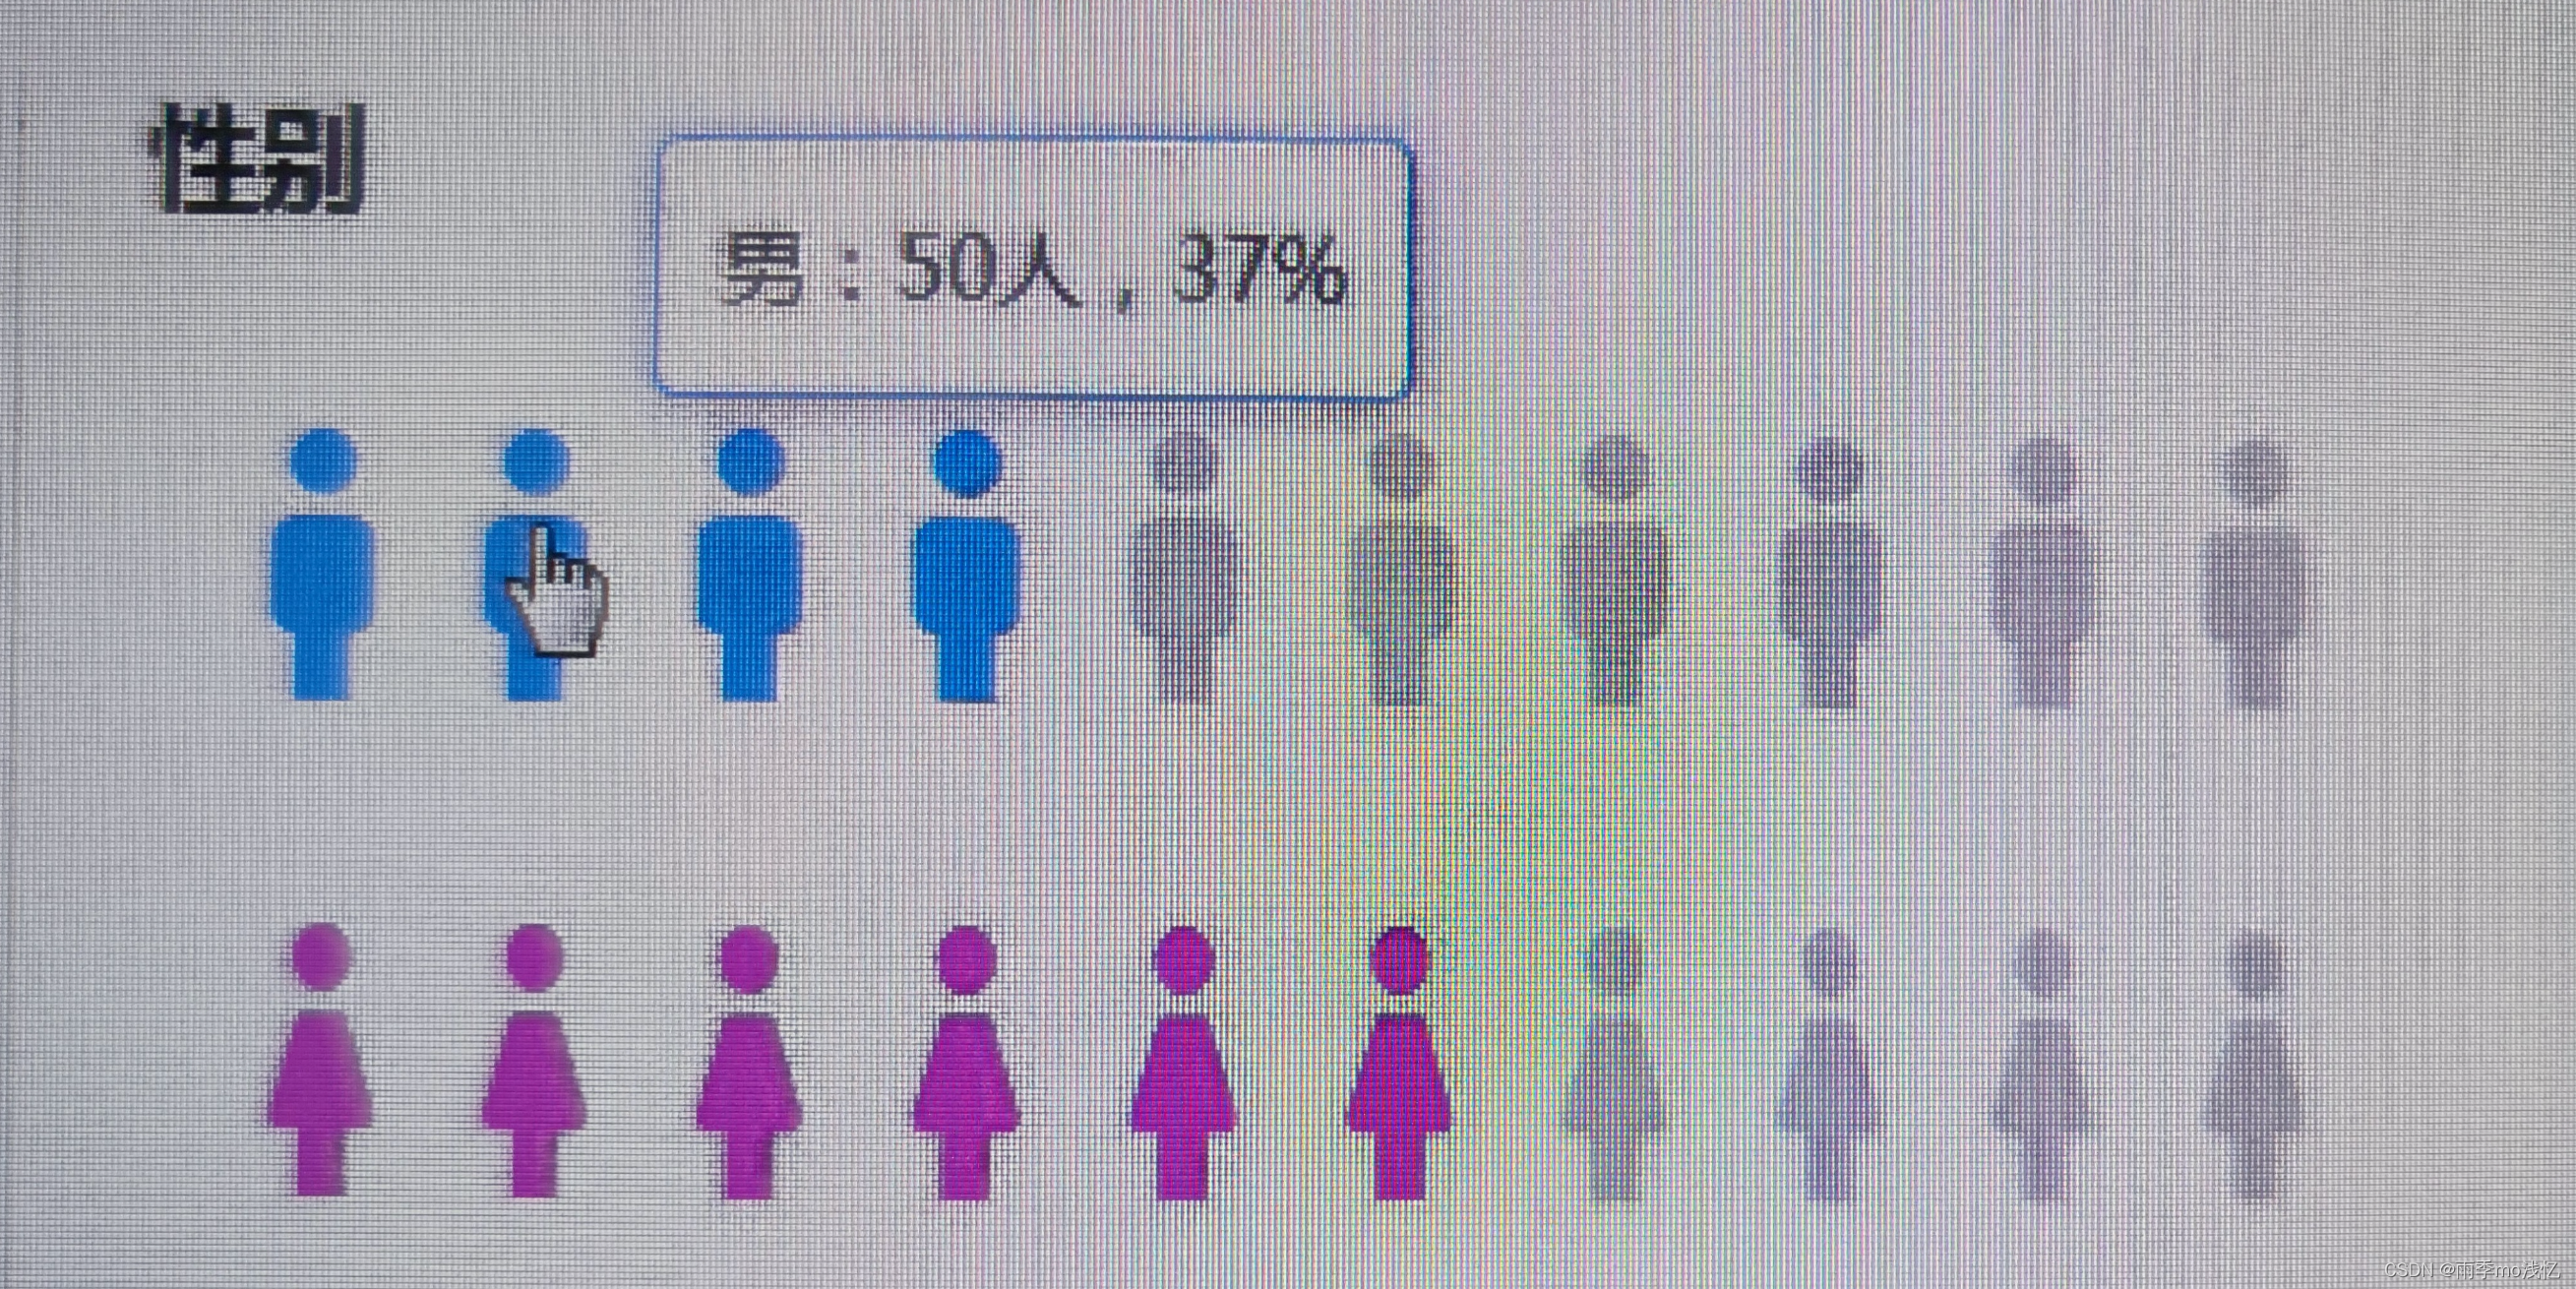
代码 实现 :
src / components / Echarts / index.vue
<!--
* 功能:echarts 图表
* 日期:2022-11
* 作者:小灰狼
-->
<template>
	<div>
		<div id="id" class="myChart" :style="setStyle"></div>
	</div>
</template>

<script>
import * as echarts from 'echarts';

export default {
	name: 'echartsChart',
	props: {
		id: {
			type: String, // 类型
			default: null, // 默认值
		},
		options: {
			type: Object, // 类型
			default: null,
		},
		setStyle: {
			type: Object, // 类型
			default: null,
		},
	},
	data() {
		return {
			myChart: null,
			myChartStyle: { height: '300px' }, // 图标样式
			tooltip: {
				trigger: 'item',
			},
			legend: {
				origin: 'vertical',
				left: 'left',
			},
		};
	},
	watch: {
		option: {
			handler(newValue) {
				this.$nextTick(() => {
					if (document.getElementById(this.id)) {
						if (!this.myChart) {
							this.myChart = echarts.init(
								document.getElementById(this.id)
							);
							// 新增配置 Echarts 图表的自带 showLoading 方法
							this.myChart.showLoading({
								text: '加载中...',
							});
							this.myChart.setOption(newValue, true);
							this.myChart.hideLoading(); // 关闭Echarts的Loading
						}
					}
				});
			},
		},
		deep: true,
	},
	mounted() {
		this.initChart(this.id, this.options);
		window.addEventListener('resize', function () {
			if (this.myChart) {
				this.myChart.resize();
			}
		});
	},
	methods: {
		initChart(id, options) {
			if (document.getElementById(id)) {
				this.myChart = echarts.init(document.getElementById(id));
				// 新增配置 Echarts 图表的自带 showLoading 方法
				this.myChart.showLoading({
					text: '加载中...',
				});
				// this.myChart.setOption(options, true);
				setTimeout(() => {
					this.myChart.setOption(options, true);
					this.myChart.hideLoading(); // 关闭Echarts的Loading
				}, 100);
			}
		},
		// 解决Echarts页面切换卡顿的问题
		beforeDestroy() {
			this.myChart.clear();
		},
	},
};
</script>

<style lang="scss" scoped>
// .myChart {
// 	width: 95%;
// 	height: 400px;
// }
</style>
src / views / ......
<template>
	<div class="sex-box">
		<div class="sex-echarts">
			<!-- 性别 -->
			<EchartsChart
				id="manChart"
				:options.sync="manOptions"
				:setStyle="sexChartCss"
			/>
			<EchartsChart
				id="womanChart"
				:options.sync="womanOptions"
				:setStyle="sexChartCss"
			/>
		</div>
	</div>
</template>

<script>
import EchartsChart from '@components/Echarts/index';
import SessionStore from '@utils/sessionStore';

export default {
	name: 'Sex Chart',
	inject: ['getCentralData'],
	comments: { EchartsChart },
	props: {
		// 性别图表样式设置
		sexChartCss: {
			typeof: Object,
			default: () => ({}), // 对象默认值写法
		},
	},
	data() {
		return {
			option1: {}, // 男
			option2: {}, // 女
			manOptions: {}, // 男
			womanOptions: {}, // 女
			sexData: {}, // 图表栏数据
			man: `path://M516.608 217.6c40.448 0 72.704-32.768 72.704-72.704 0-40.448-32.768-72.704-72.704-72.704-40.448 0-72.704 32.768-72.704 72.704s32.256 72.704 72.704 72.704z m80.384 18.432H435.712c-51.2 0-93.696 41.472-93.696 93.184v225.28c0 17.408 13.824 31.744 31.232 31.744s31.744-14.336 31.744-31.744V351.744h16.384v565.76c0 23.552 18.944 42.496 43.008 42.496 23.552 0 42.496-18.944 42.496-42.496V588.8h17.408v328.192c0 23.552 18.944 42.496 42.496 42.496 23.552 0 43.008-18.944 43.008-42.496V351.744h16.384v203.264c0 17.408 14.336 31.744 31.744 31.744 17.408 0 31.232-14.336 31.232-31.744v-225.28c1.024-51.712-40.96-93.696-92.16-93.696z`,
			girl: `path://M693.064905 504.590142l-55.845778-202.954549c-7.532724-22.967796-34.488553-63.372358-79.685923-65.239925h-89.777337c-46.750604 1.927976-73.520086 41.894316-80.000256 65.365863l-55.777177 202.707792c-11.954885 44.266658 39.220951 61.57032 51.857744 19.985218l49.867311-187.020846h14.008799l-85.85176 328.529989h80.247012v246.909946c0 44.697714 60.764522 44.697714 60.764522 0v-246.909946h18.924473v246.909946c0 44.697714 58.766922 44.697714 58.766922 0v-246.909946h82.427888l-87.654823-328.529989h15.938823l49.988129 187.020846c12.331675 42.517862 63.256659 24.280417 51.801431-19.864399zM512.336858 219.833299c38.471467 0 69.538196-32.435663 69.538196-72.527941 0-40.031868-31.066729-72.528965-69.538196-72.528965-38.415154 0-69.48393 32.497096-69.48393 72.528965 0 40.030845 31.0698 72.527941 69.48393 72.527941z`,
		};
	},
	created() {
		if (
			SessionStore.get('dataInfo') != '' ||
			SessionStore.get('dataInfo') != null ||
			SessionStore.get('dataInfo') != undefined
		) {
			this.sexData = SessionStore.get('dataInfo');
			this.mans(this.sexData.manNum, this.sexData.manCount, 10);
			this.womans(this.sexData.womanNum, this.sexData.womanCount, 10);
			this.manOptions = this.option1;
			this.womanOptions = this.option2;
		}
	},
	methods: {
		mans(boyNum, boyCount, max) {
			this.option1 = {
				color: ['rgb(87,138,248)', 'rgb(212,212,212)'],
				tooltip: {
					show: true,
					trigger: 'item',
					formatter: (params) => {
						// return `男:${boyNum}人,${params.value * 10}%`
						if (params.componentIndex === 0) {
							return `男:${boyNum}人,${params.value * 10}%`;
						} else {
							return ``;
							// return `男:${(10 - boyCount) * 10}%`;
						}
					},
				},
				legend: {
					left: '20px',
					top: 'bottom',
					orient: 'vertical',
					data: ['男', '女'],
				},
				xAxis: {
					type: 'value',
					max: max,
					splitLine: { show: false },
					offset: 10,
					axisLine: {
						show: false,
						lineStyle: {
							color: 'red',
						},
					},
					axisLabel: {
						show: false,
						margin: 10,
					},
				},
				yAxis: {
					type: 'category',
					data: ['男'],
					inverse: true,
					axisTick: { show: false },
					axisLine: { show: false },
					axisLabel: {
						show: false,
						margin: 10,
						color: '#999',
						fontSize: 16,
					},
				},

				series: [
					{
						center: ['70%', '50%'],
						// current data
						type: 'pictorialBar',
						symbol: this.man,
						symbolRepeat: 'false',
						symbolMargin: [10, 0],
						symbolClip: true,
						symbolSize: [17, 44],
						symbolBoundingData: max,
						// data: [mannum],
						data: [boyCount],
						z: 10,
					},
					{
						center: ['70%', '50%'],
						type: 'pictorialBar',
						label: {
							show: false,
						},
						animationDuration: 0,
						symbolRepeat: 'fixed',
						symbolMargin: [10, 0],
						symbol: this.man,
						symbolSize: [17, 44],
						symbolBoundingData: max,
						data: [max],
						z: 5,
					},
				],
			};
		},
		womans(girlNum, girlCount, max) {
			this.option2 = {
				color: ['rgb(230,104,198)', 'rgb(212,212,212)'],
				tooltip: {
					show: true,
					trigger: 'item',
					formatter: (params) => {
						if (params.componentIndex === 0) {
							return `女:${girlNum}人,${params.value * 10}%`;
						} else {
							return ``;
							// return `女:${(10 - girlCount) * 10}%`;
						}
					},
				},
				// legend: {
				//   left: '20px',
				//   top: 'bottom',
				//   orient: 'vertical',
				//   data: ['男', '女'],
				// },
				xAxis: {
					type: 'value',
					max: max,
					splitLine: { show: false },
					offset: 10,
					axisLine: {
						show: false,
						lineStyle: {
							color: '#999',
						},
					},
					axisLabel: {
						show: false,
						margin: 10,
					},
				},
				yAxis: {
					type: 'category',
					data: ['女'],
					inverse: true,
					axisTick: { show: false },
					axisLine: { show: false },
					axisLabel: {
						show: false,
						margin: 10,
						color: '#999',
						fontSize: 16,
					},
				},

				series: [
					{
						center: ['70%', '50%'],
						// current data
						type: 'pictorialBar',
						symbol: this.girl,
						symbolRepeat: 'false',
						symbolMargin: [10, 0],
						symbolClip: true,
						symbolSize: [17, 44],
						symbolBoundingData: max,
						data: [girlCount],
						z: 10,
					},
					{
						center: ['70%', '50%'],
						type: 'pictorialBar',
						itemStyle: {
							normal: {},
						},
						label: {
							show: false,
						},
						animationDuration: 0,
						symbolRepeat: 'fixed',
						symbolMargin: [10, 0],
						symbol: this.girl,
						symbolSize: [17, 44],
						symbolBoundingData: max,
						data: [max],
						z: 5,
					},
				],
			};
		},
	},
	watch: {
		centralData: {
			handler: function (newValue) {
				this.$nextTick(() => {
					this.sexData = newValue; // 重新赋值
					this.mans(this.sexData.manNum, this.sexData.manCount, 10);
					this.womans(
						this.sexData.womanNum,
						this.sexData.womanCount,
						10
					);
					this.manOptions = this.option1;
					this.womanOptions = this.option2;
				});
			},
		},
	},
	computed: {
		centralData() {
			return this.getCentralData();
		},
	},
};
</script>

<style lang="scss" scoped>
.sex-box {
	position: relative;
	.sex-echarts {
		position: absolute;
		top: 68px;
	}
}
</style>
src / utils / sessionStore.js
/**
 * sessionStorage 会话存储
 * 小灰狼
 * 2022-11
 */

class SessionStore {
	// 获取
	get(key) {
		// 会话存储 + 取 :
		let value = sessionStorage.getItem(key) || '';
		if (/^[\[\{]/.test(value)) {
			value = JSON.parse(value);
		}
		return value;
	}

	// 设置
	set(key, value) {
		if (typeof value === 'object') {
			value = JSON.stringify(value);
		}
		sessionStorage.setItem(key, value);
	}

	// 删除
	delay(key) {
		sessionStorage.removeItem(key);
	}
}

export default new SessionStore();