版权声明:本文为博主原创文章,未经博主允许不得转载 https://blog.csdn.net/qq983392709/article/details/85680252
本文使用python中的itchat模块获取微信信息,并用matlab进行数据显示,这两个模块没有的可直接在控制台 pip install ** 进行安装,话不多说,先上效果图
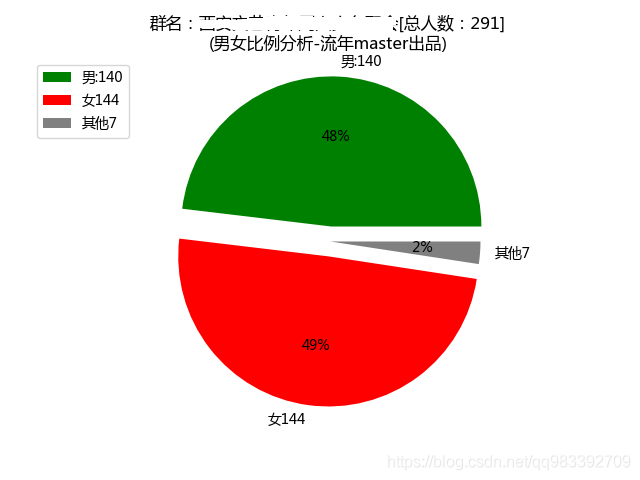
一、男女比例分析
二、各个地区的男女数量-柱状图

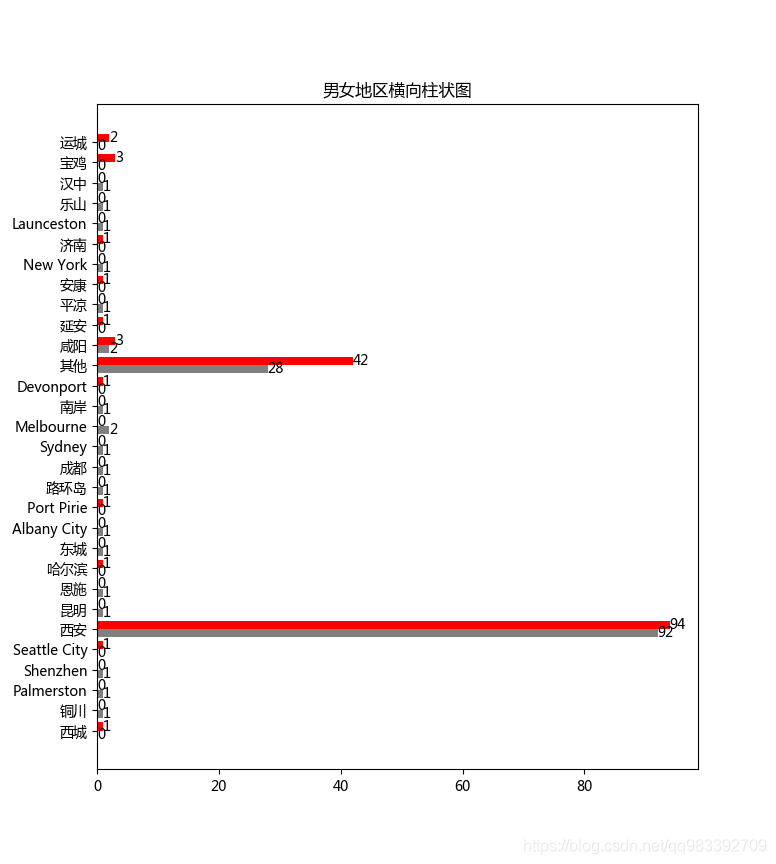
三、各个地区的男女数量-横向柱状图(地区标签比较清晰)
下来一 一上代码,做这个主要还是看数据怎么分析,以及运用下图表的显示方式,matlab挺强大的,支持一下
一,饼状图代码
扫描二维码关注公众号,回复:
4759865 查看本文章

import itchat, time
import matplotlib.pyplot as plot

def chatProportion():
    itchat.auto_login(True)
    male = female = other = 0
    rName = "群名称,自己填"
    roomSum = 0
    chatRooms = itchat.search_chatrooms(name=rName)
    if chatRooms is None:
        print("no this:" + rName)
    else:
        chatRoom = itchat.update_chatroom(chatRooms[0]['UserName'], detailedMember=True)
        index = 0
        mem_list = chatRoom['MemberList']
        roomSum = len(mem_list)
        for friend in mem_list:
            dis = friend['DisplayName']
            nick = friend['NickName']
            sex = friend['Sex']
            if sex == 1:
                male += 1
            elif sex == 2:
                female += 1
            else:
                other += 1
            index += 1
            print(index,dis,nick,sex)
    labels = ['男:'+str(male),'女'+str(female),'其他'+str(other)]
    sizes = [male, female, other]
    colors = ['green','red','gray']
    # 几个分量向外偏移
    explode = (0.1,0.1,0)
    plot.pie(sizes,explode,labels,colors,'%2.0f%%')
    plot.axis('equal')
    plot.legend(loc='upper left', bbox_to_anchor=(-0.1, 1))
    plot.rcParams['font.sans-serif'] = ['Microsoft YaHei']
    plot.rcParams['axes.unicode_minus'] = False
    plot.title("群名:"+str(rName)+"[总人数:"+str(roomSum)+"]\n"+str("(男女比例分析-流年master出品)"))
    plot.grid()
    plot.show()

if __name__ == "__main__":
    chatProportion()
二、柱状图代码
import itchat, time
import matplotlib.pyplot as plt

def getInfo():
    # 测试数据
    # info = []
    # city_list = ["西安","大理","西安","city","西安","西安","","大理"]
    # sex_list = ["男","女","男"]
    # for city in city_list:

    #     for sex in sex_list:
    #         per_info = {
    #             'city':None,
    #             'sex':None
    #         }
    #         if city == "":
    #             city = "其他"

    #         per_info['city'] = city
    #         per_info['sex'] = sex
    #         info.append(per_info)

    # return info

    data_info = []
    itchat.auto_login(True)
    rName = "群名称,自己填"
    chatRooms = itchat.search_chatrooms(name=rName)
    if chatRooms is None:
        print("no this:" + rName)
    else:
        chatRoom = itchat.update_chatroom(chatRooms[0]['UserName'], detailedMember=True)
        mem_list = chatRoom['MemberList']
        for friend in mem_list:
            sex = friend['Sex']
            city = friend['City']

            per_info = {
                'city':None,
                'sex':None
            }
            if city == "":
                city = "其他"
            per_info['city'] = city
            per_info['sex'] = sex
            data_info.append(per_info)
    return data_info

def cityData():
    info = getInfo()
    city_list = []
    for ereryOne in info:
        city_list.append(ereryOne['city'])

    # 归一去重
    single_list = set(city_list)
    men_arr = []
    women_arr = []
    for single in single_list:
        men_count = 0
        women_count = 0
        for everyOne in info:
            if everyOne['city'] == single:
                if everyOne['sex'] == 1 or everyOne['sex'] == "男":
                    men_count += 1
                else:
                    women_count += 1
        men_arr.append(men_count)
        women_arr.append(women_count)

    x_dir = list(range(len(single_list)))
    ax = plt.subplot()
    wid = 0.4
    tick_loc = []
    for i in range(len(single_list)):
        tick_loc.append(i + wid/2)

    # 1 竖向柱状图
    # label1 = plt.bar(x_dir, men_arr, width=wid, fc='gray')
    # for rect in label1:
    #     height = rect.get_height()
    #     # .-0.1 : 反向移动0.1
    #     plt.text(rect.get_x()+rect.get_width()/2.-0.1, 1.03*height, "%s" % float(height))

    # # 第二个柱状图向右偏移一点
    # for i in range(len(x_dir)):
    #     x_dir[i] += wid
    # label2 = plt.bar(x_dir, women_arr, width=wid, fc='r')
    # for rect in label2:
    #     height = rect.get_height()
    #     plt.text(rect.get_x()+rect.get_width()/2.-0.1, 1.03*height, "%s" % float(height))

    # # 横向标签位置
    # ax.set_xticks(tick_loc)
    # # 横向标签名称
    # ax.set_xticklabels(single_list)
    # plt.rcParams['font.sans-serif'] = ['Microsoft YaHei']
    # plt.title("男女地区竖向柱状图")
    # plt.show()

    # 2 横向柱状图
    label1 = ax.barh(x_dir, men_arr, height=wid, fc='gray')
    for rect in label1:
        w = rect.get_width()
        ax.text(w, rect.get_y()+rect.get_height()/2, '%d'%int(w), ha='left',va='center')

    # 第二个柱状图向右偏移一点
    for i in range(len(x_dir)):
        x_dir[i] += wid
    label2 = ax.barh(x_dir, women_arr, height=wid, fc='r')
    for rect in label2:
        w = rect.get_width()
        ax.text(w, rect.get_y()+rect.get_height()/2, '%d'%int(w), ha='left',va='center')

    # 纵向标签位置
    ax.set_yticks(tick_loc)
    # 纵向标签名称
    ax.set_yticklabels(single_list)
    plt.rcParams['font.sans-serif'] = ['Microsoft YaHei']
    plt.title("男女地区横向柱状图")
    plt.show()

if __name__ == "__main__":
    cityData()