prometheus 四种数据类型学习及测试
安装
1)从官网下载对应版本的二进制压缩包并解压
2)新建prometheus.yml 文件,静态指定抓取本机的9091端口,设置采样时间2秒1次,方便一会测试。
scrape_configs:
  - job_name: 'definejob'
    scrape_interval: 2s
    static_configs:
    - targets: ['localhost:9091']
3)执行 ./prometheus --config.file=./prometheus.yml, config路径是上一步编写的文件。
四种数据类型
1)Counter
单调递增的数据,可用于统计API的调用次数,在服务重启后,变为0。编写测试用例,每两秒钟增加一次Counter。
package main

import (
	"net/http"
	"time"

	"github.com/prometheus/client_golang/prometheus"
	"github.com/prometheus/client_golang/prometheus/promauto"
	"github.com/prometheus/client_golang/prometheus/promhttp"
)

var (
	api_request = promauto.NewCounter(
		prometheus.CounterOpts{


			Name:        "api_request",
		})
)

func main() {


	http.HandleFunc("/", func(res http.ResponseWriter, req *http.Request){


		api_request.Inc()
		res.Write([]byte("it's ok!"))
	})

	go func() {


		// 模拟访问浏览器
		time.Sleep(time.Second)
		client := &http.Client{

    Timeout: time.Duration(10 * time.Second)}
		for i := 0;i < 2000; i++{


			req, err := http.NewRequest("GET", "http://127.0.0.1:9091", nil)
			if err != nil {


				panic(err)
			}

			response, err := client.Do(req)
			if err != nil {


				panic(err)
			}

			if response != nil {


				response.Body.Close()
			}
			time.Sleep(2 * time.Second)
		}
	}()

	http.Handle("/metrics", promhttp.Handler())
	http.ListenAndServe(":9091", nil)
}
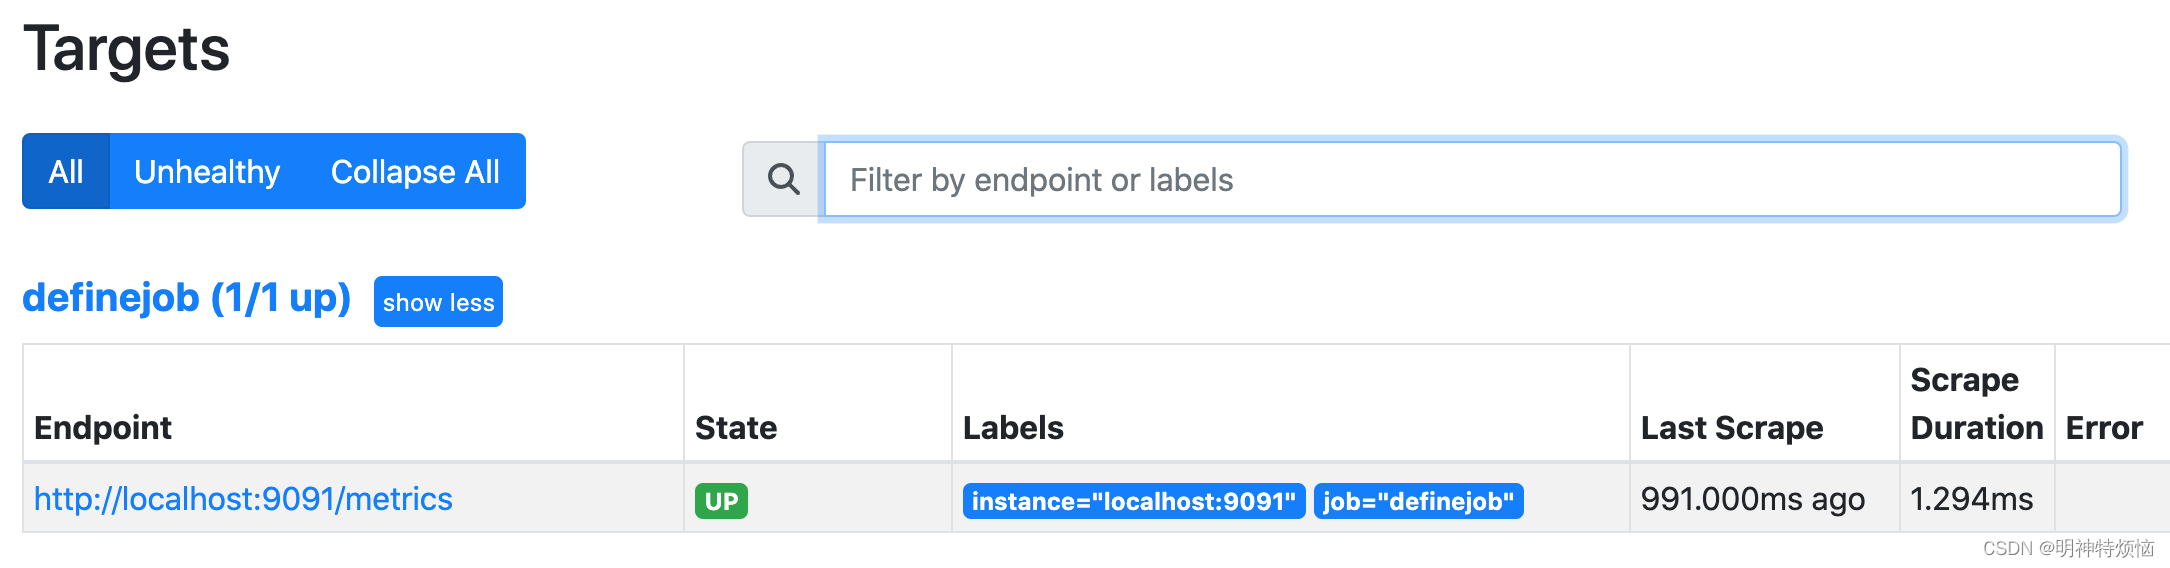
访问localhost:9090,Status->Targets
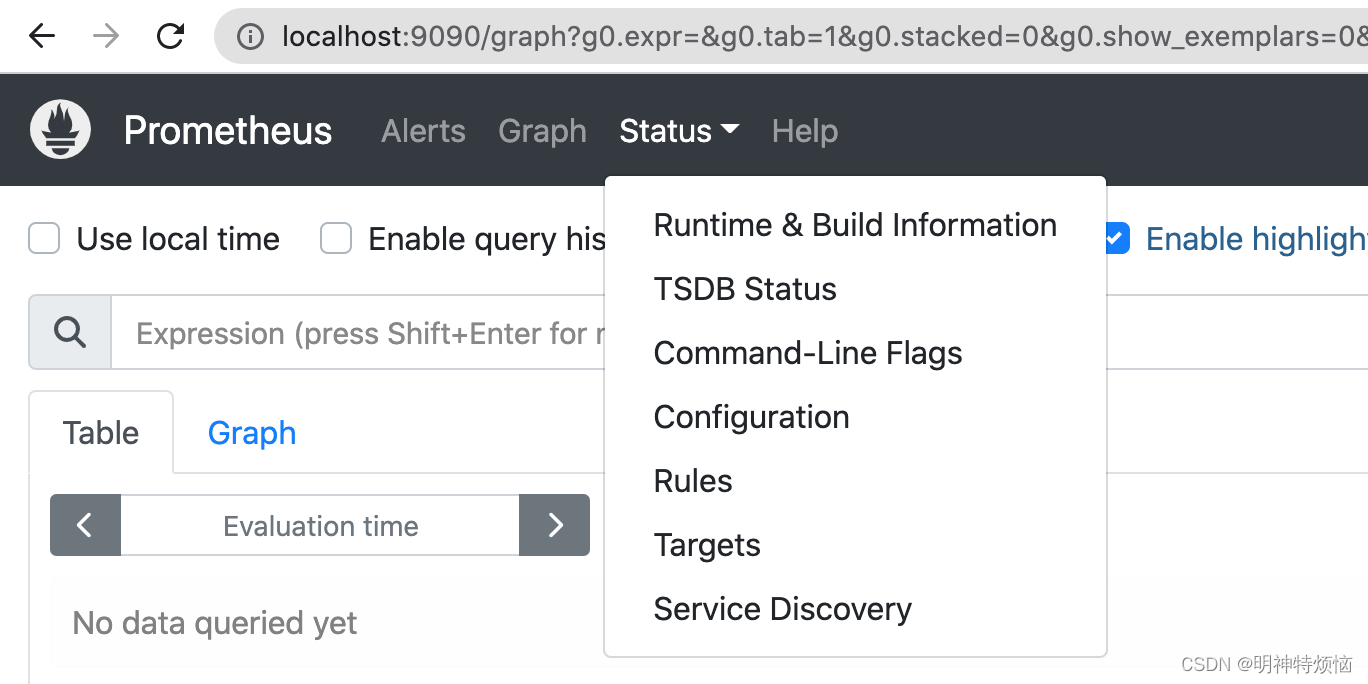
可以看到应用被成功监控到。
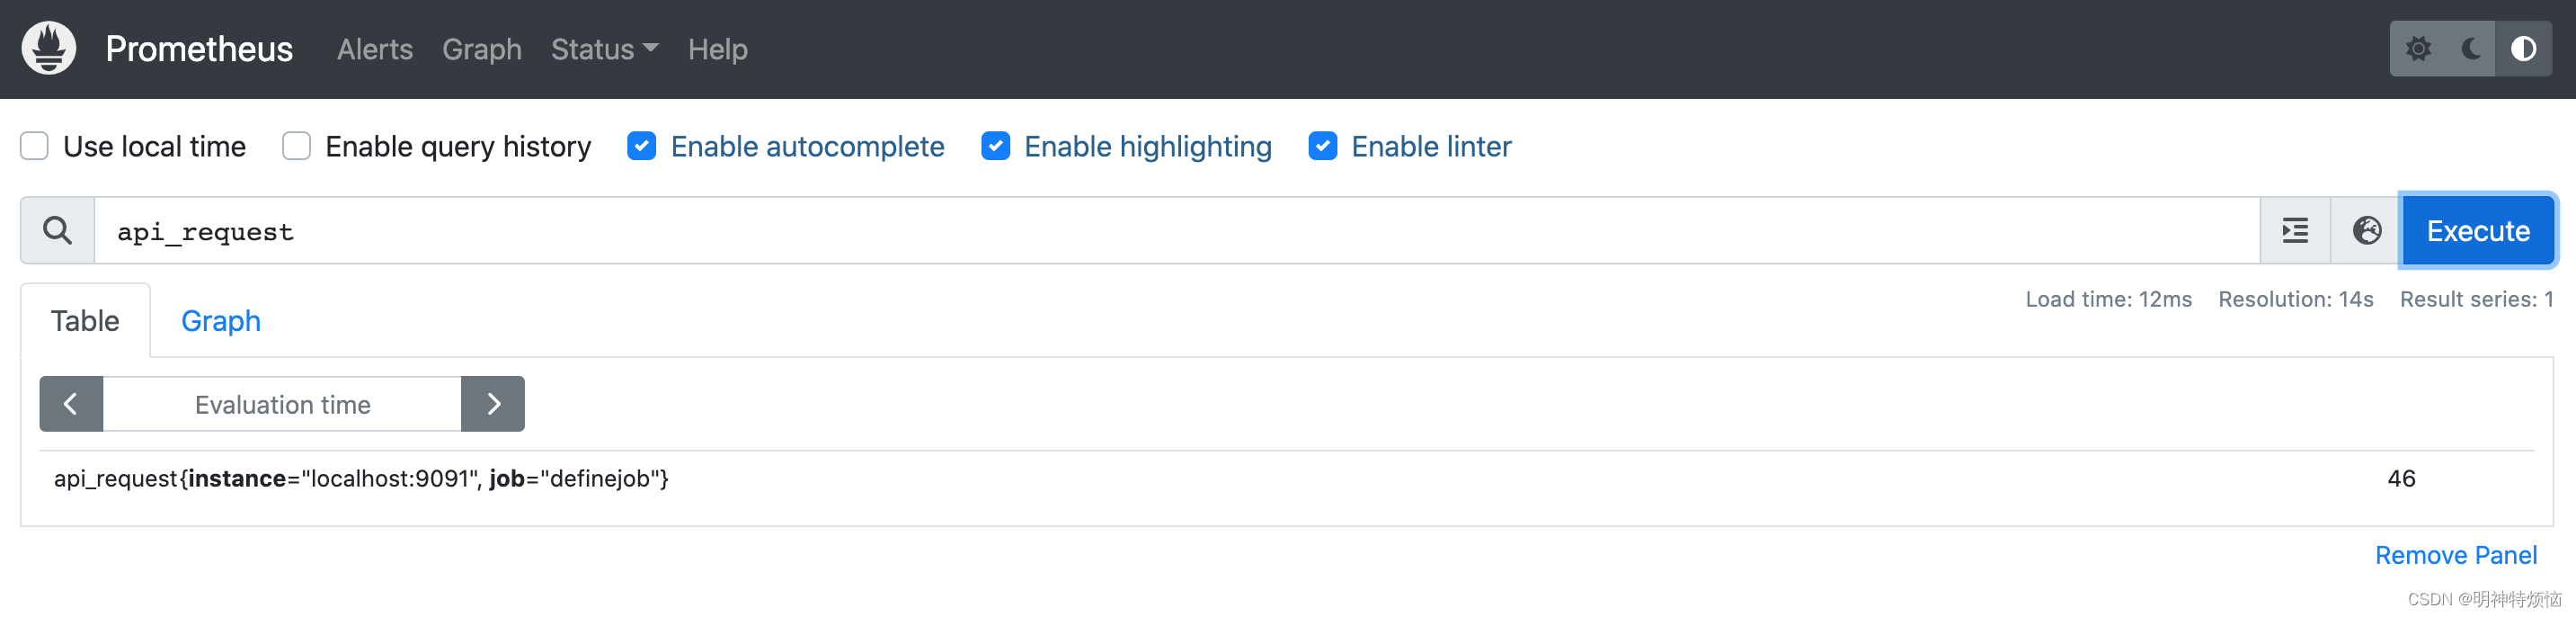
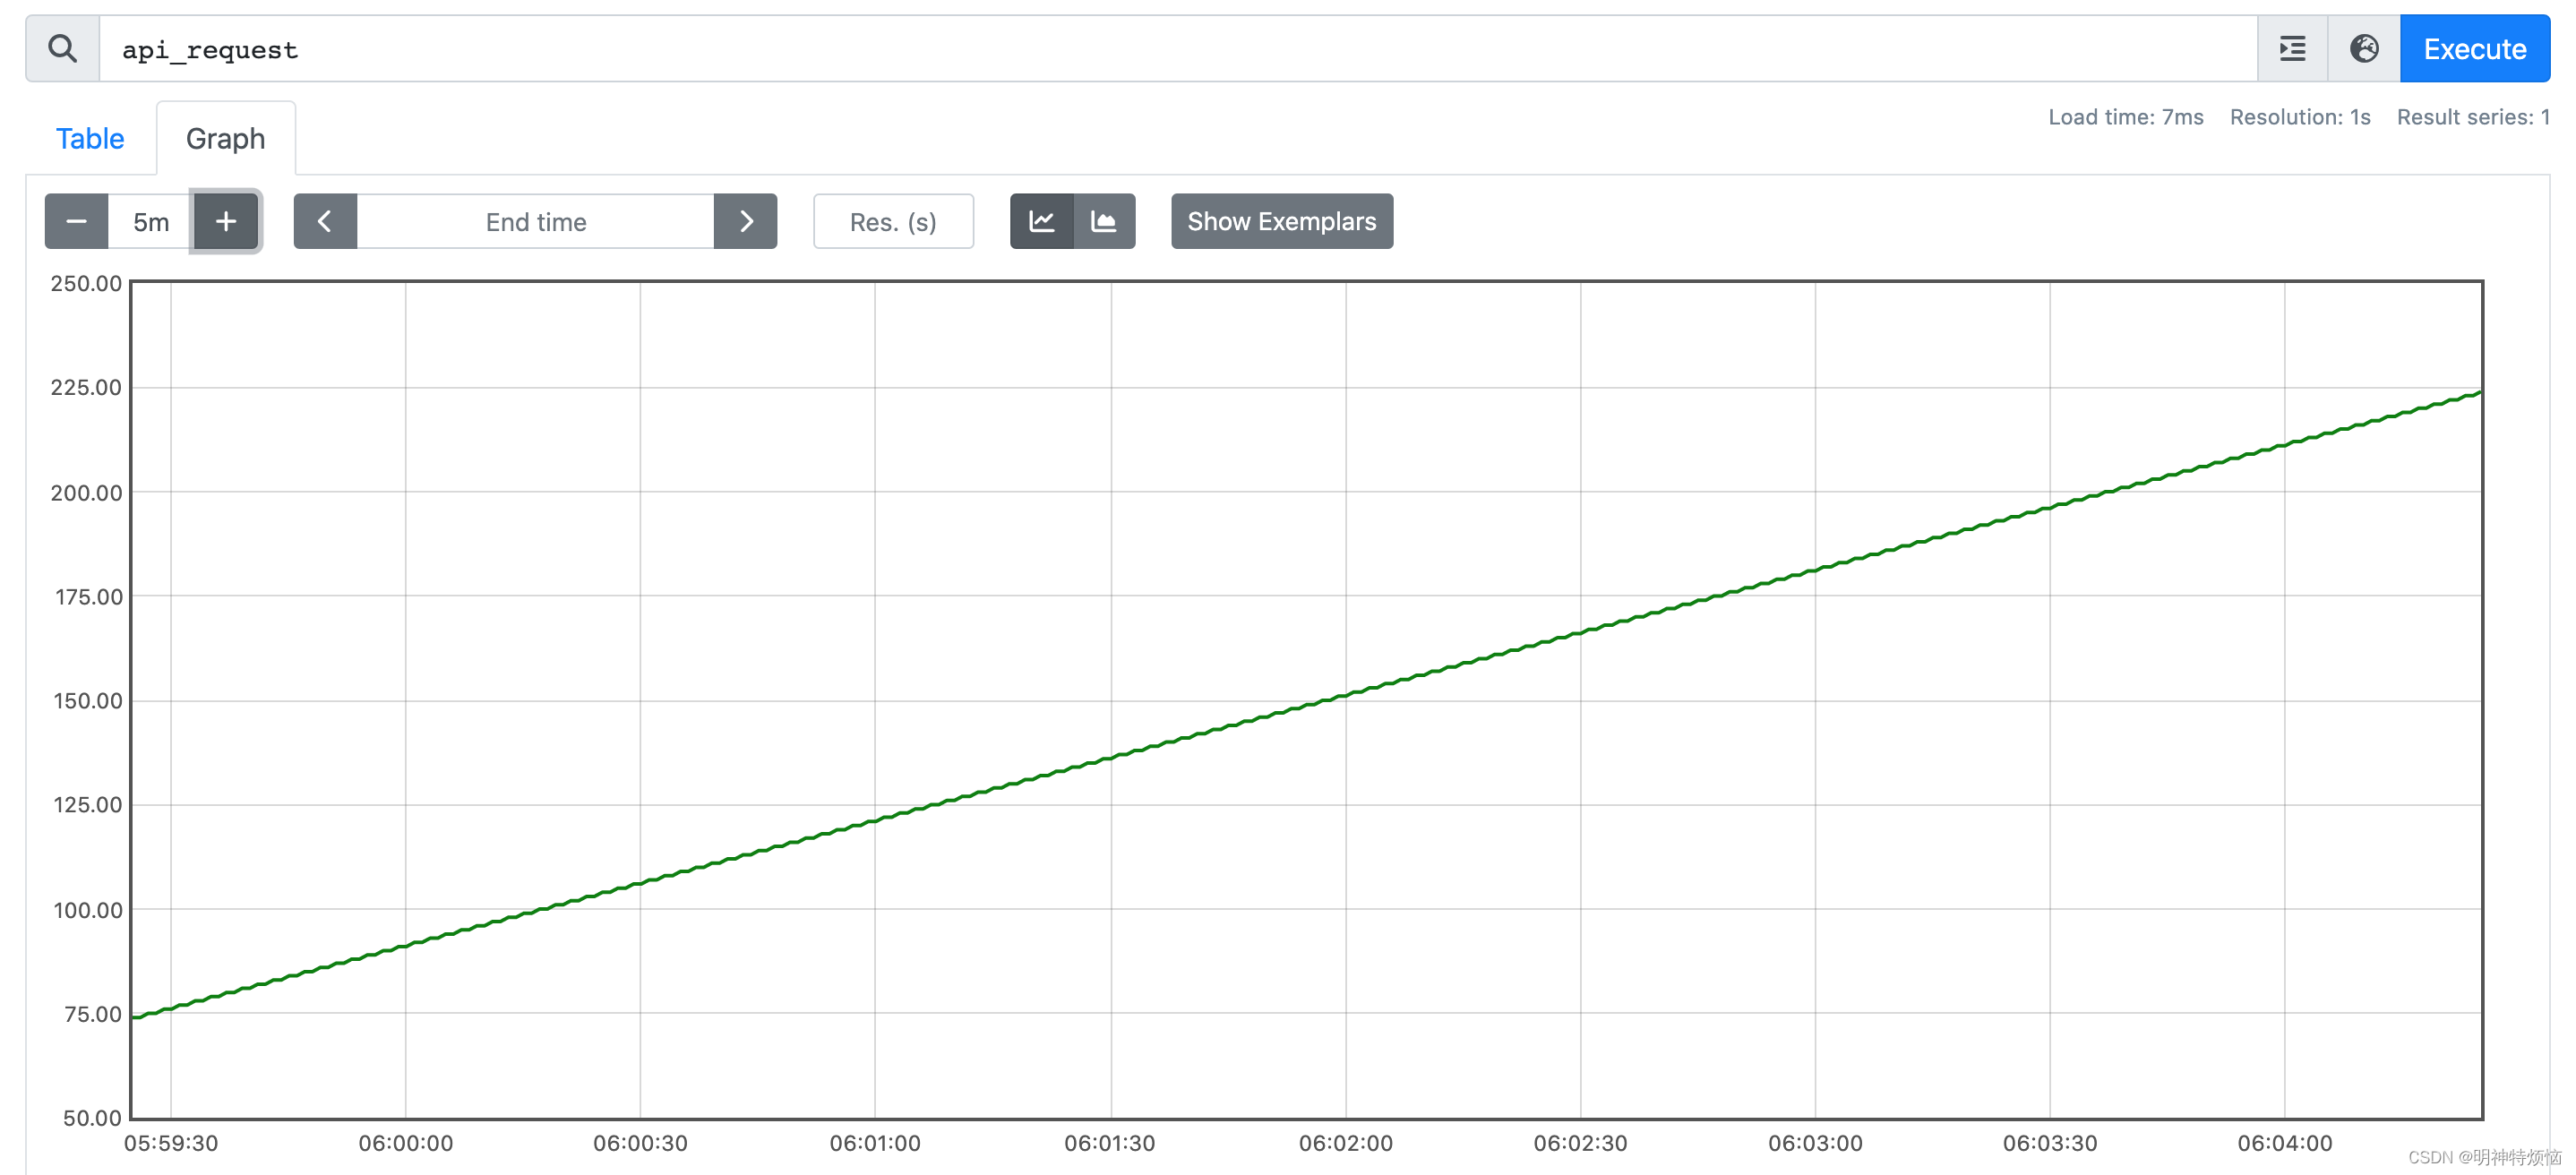
查询api_request Counter正在逐渐增长
使用瞬时向量绘制图标
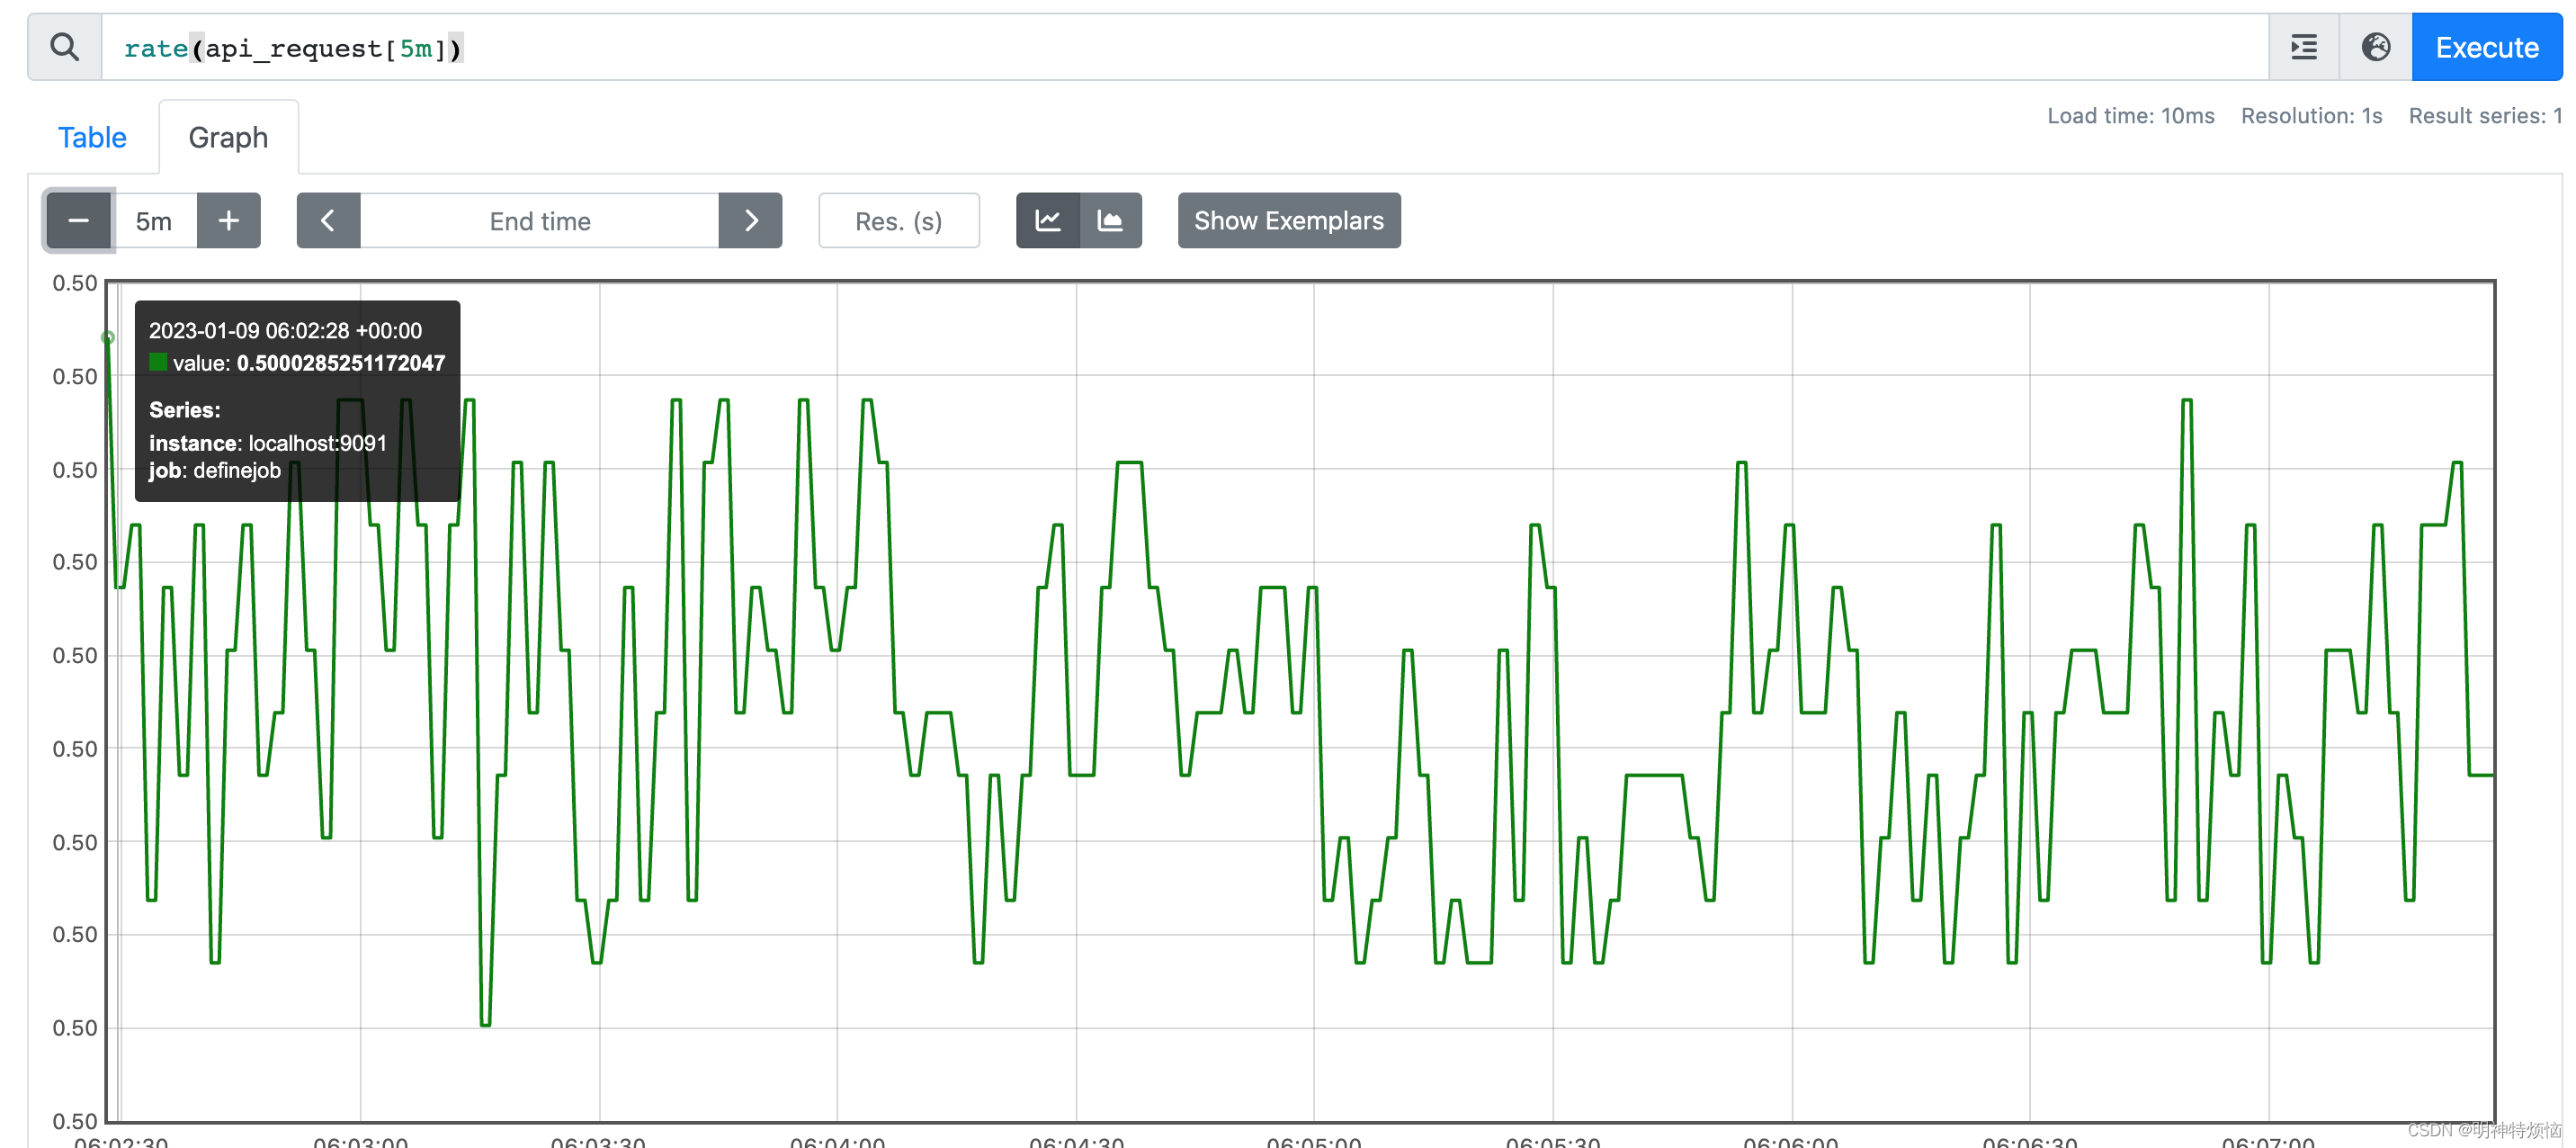
查看变化率,可以看出基本在0.5 上下波动,我们每两秒Counter+1, 平均一秒增加0.5
2)Gauge
仪表盘,用于统计一组变化的数字,例如内存使用、CPU使用率等。这里举例统计服务端维护的session个数。
package main

import (
	"math/rand"
	"net/http"
	"time"

	"github.com/prometheus/client_golang/prometheus"
	"github.com/prometheus/client_golang/prometheus/promauto"
	"github.com/prometheus/client_golang/prometheus/promhttp"
)

var (
	session_count = promauto.NewGauge(
		prometheus.GaugeOpts{


			Name:        "session_count",
		})
)

func main() {


	go func() {


		for i := 0;i < 2000; i++{


			session_count.Set(float64(rand.Intn(1000)))
			time.Sleep(2 * time.Second)
		}
	}()

	http.Handle("/metrics", promhttp.Handler())
	http.ListenAndServe(":9091", nil)
}
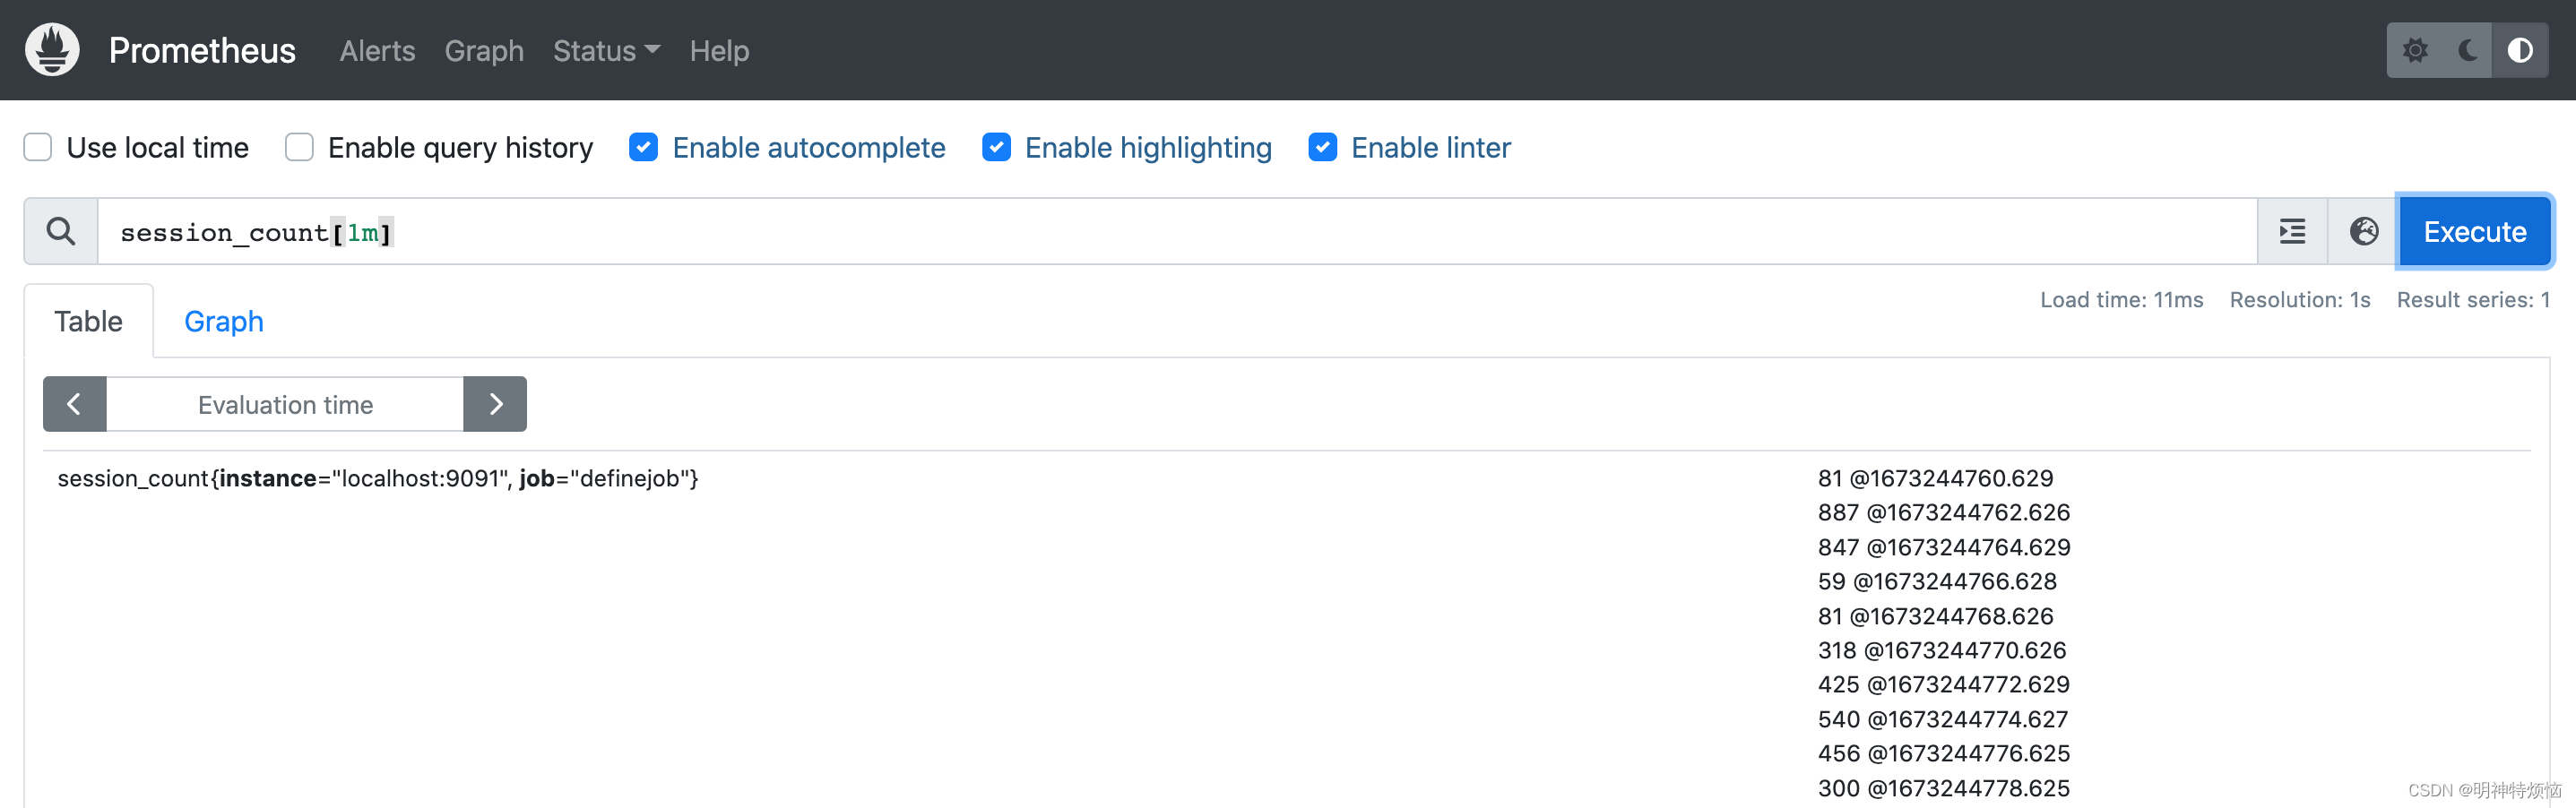
查看一分钟内session变化
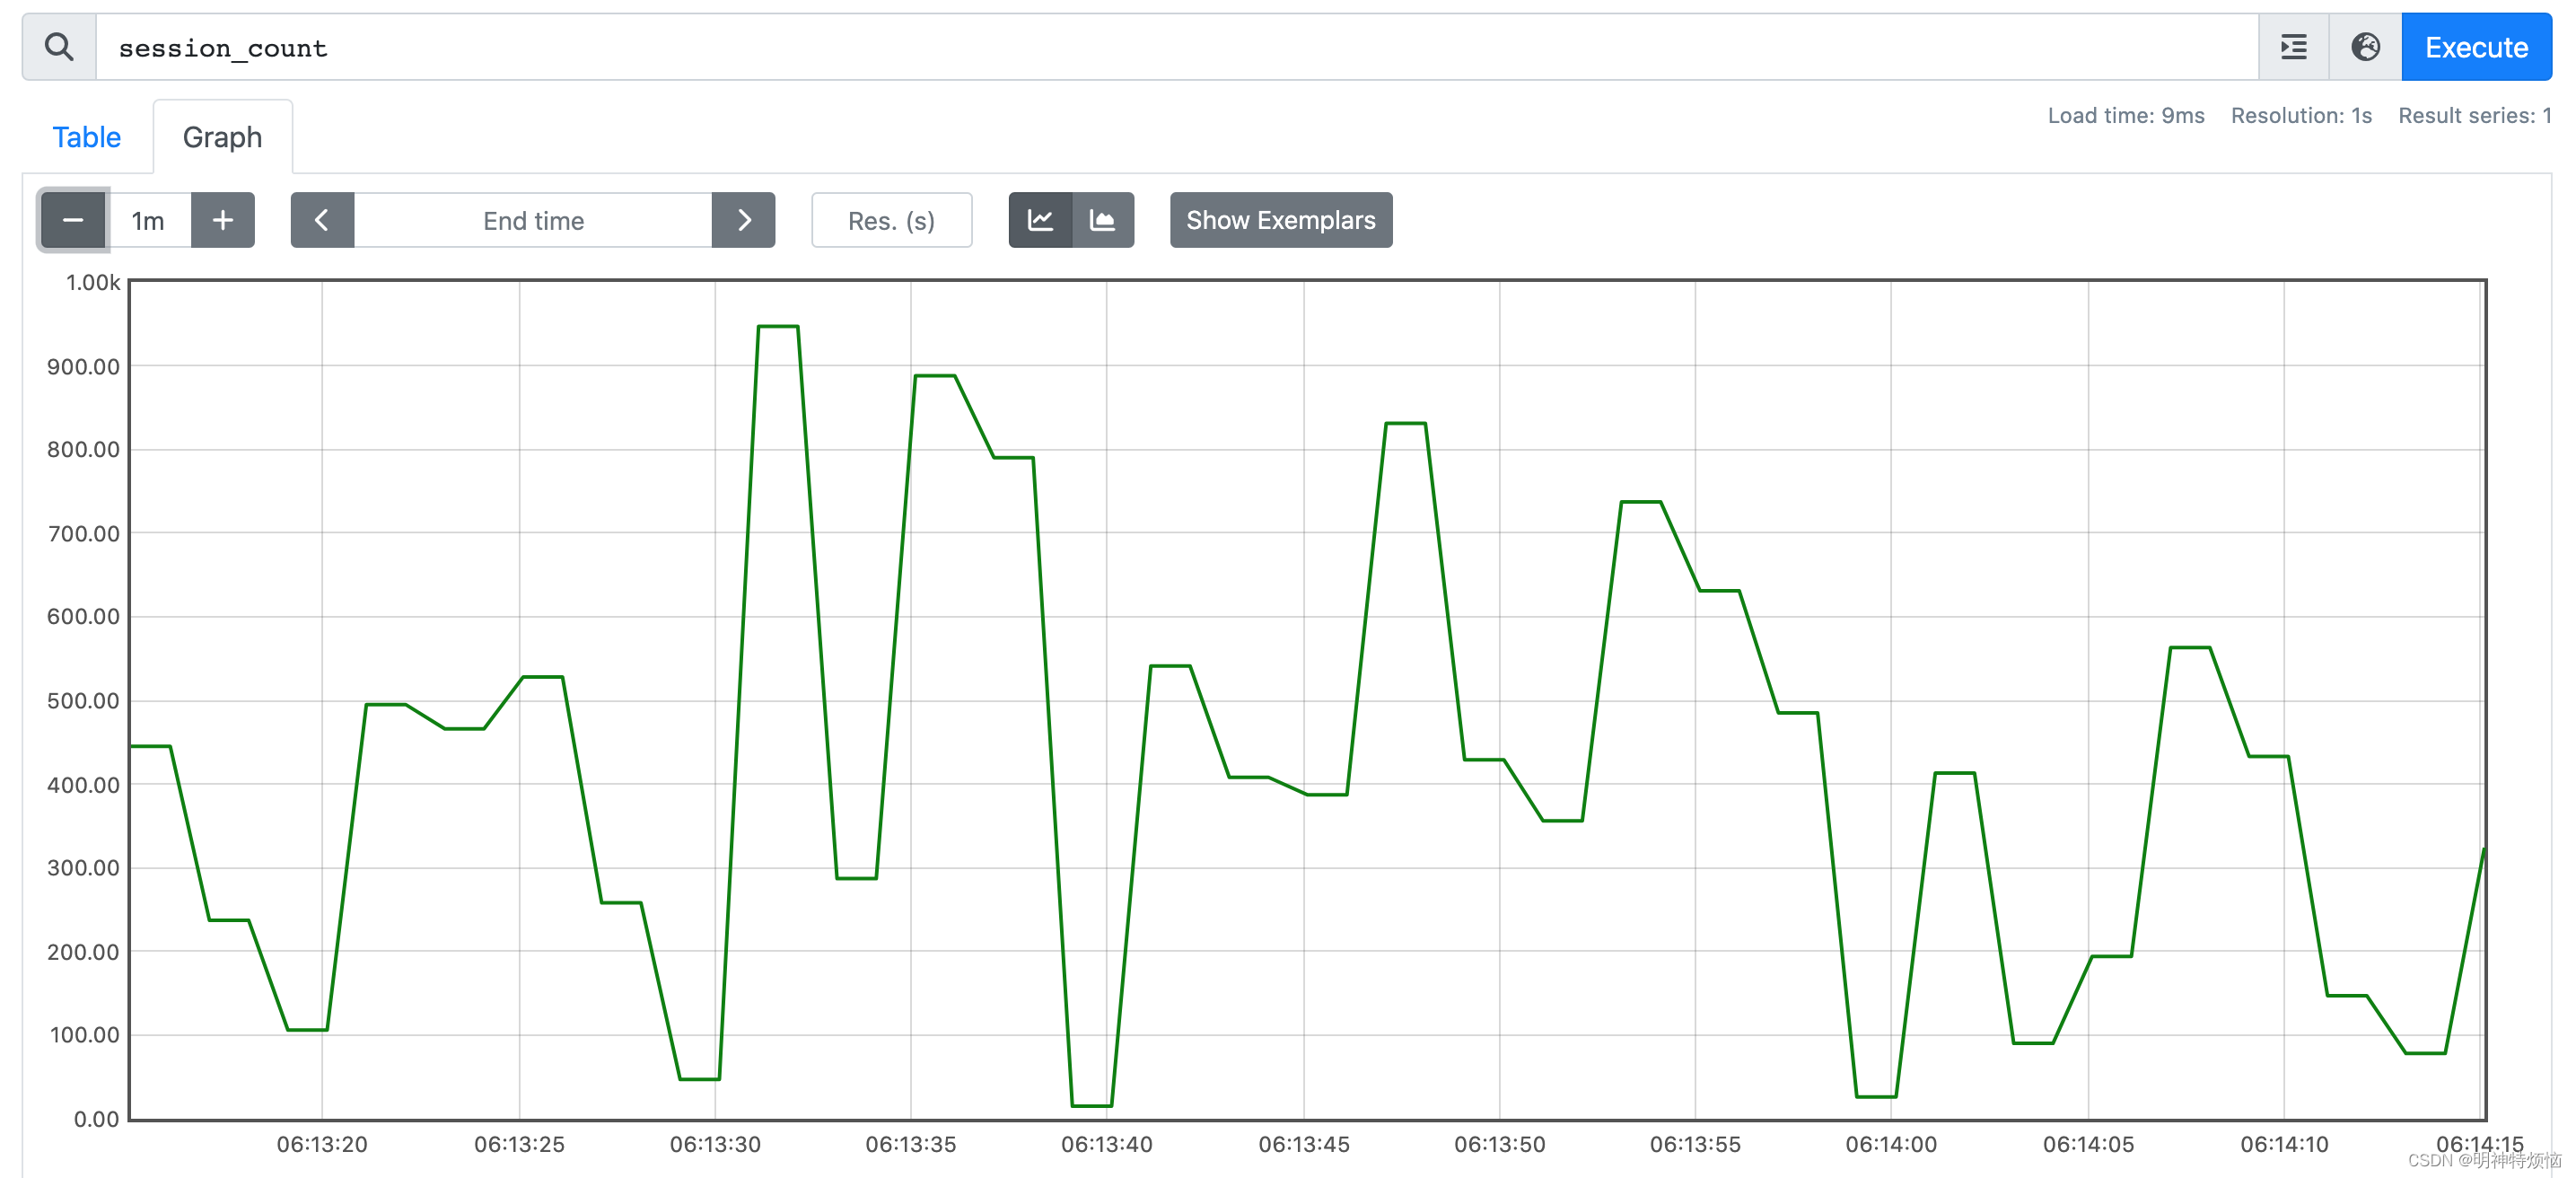
将上面的各瞬时向量绘制成曲线
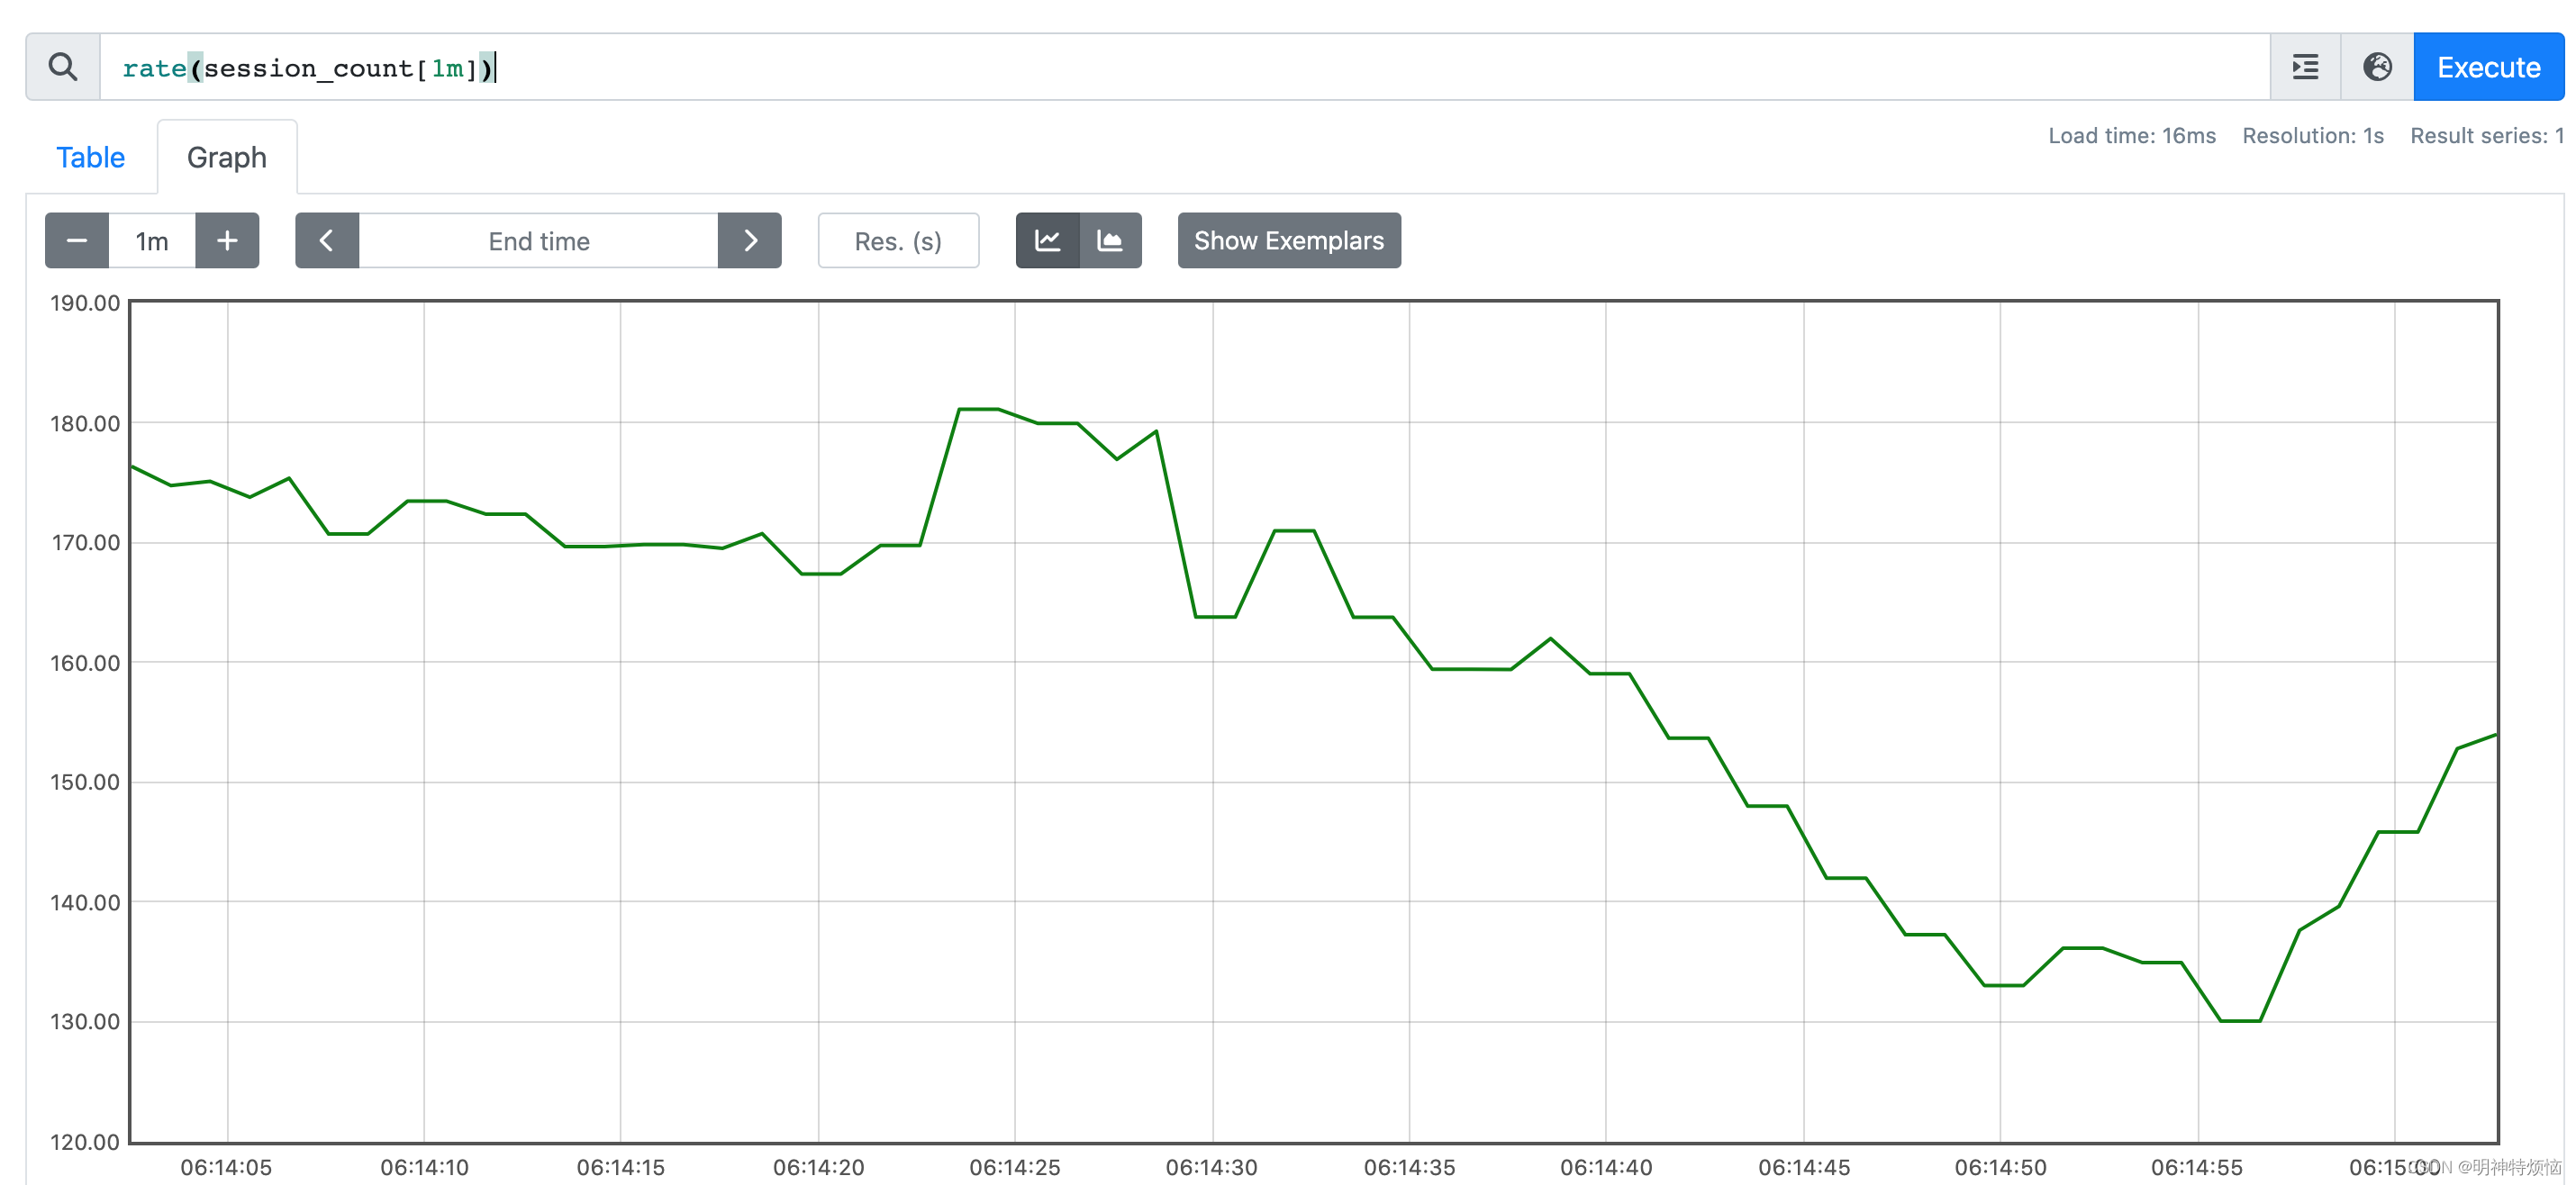
查看增长率,由于随机数据,增长率变化很大
3)Histogram
直方图,将数据范围划分成多个桶bucket,每个桶存储指定范围的数据。案例桶记录请求响应时间,分成100毫秒以下,100 ~ 800毫秒,800 ~ 1000毫秒,1000毫秒以上
package main

import (
	//"fmt"
	"github.com/prometheus/client_golang/prometheus"
	"github.com/prometheus/client_golang/prometheus/promauto"
	"math/rand"
	"net/http"
	"time"

	"github.com/prometheus/client_golang/prometheus/promhttp"
)

var (
	http_request_duration_seconds = promauto.NewHistogram(
		prometheus.HistogramOpts{


		Name:		"http_request_duration_seconds",
		Buckets:	[]float64{

    .1, .8, 1},
		})
)

func main() {


	http.HandleFunc("/", func(res http.ResponseWriter, req *http.Request){


		now := time.Now()

		time.Sleep(time.Duration(rand.Intn(1000)) * time.Millisecond)
		http_request_duration_seconds.Observe(time.Since(now).Seconds())
		res.Write([]byte("it's ok!"))
		//res.WriteHeader(http.StatusOK)
	})

	go func() {


		// 模拟访问浏览器
		time.Sleep(time.Second)
		client := &http.Client{

    Timeout: time.Duration(10 * time.Second)}
		for i := 0;i < 2000; i++{


			req, err := http.NewRequest("GET", "http://127.0.0.1:9091", nil)
			if err != nil {


				panic(err)
			}

			response, err := client.Do(req)
			if err != nil {


				panic(err)
			}

			if response != nil {


				response.Body.Close()
			}
			time.Sleep(2 * time.Second)
		}
	}()

	http.Handle("/metrics", promhttp.Handler())
	http.ListenAndServe(":9091", nil)
}
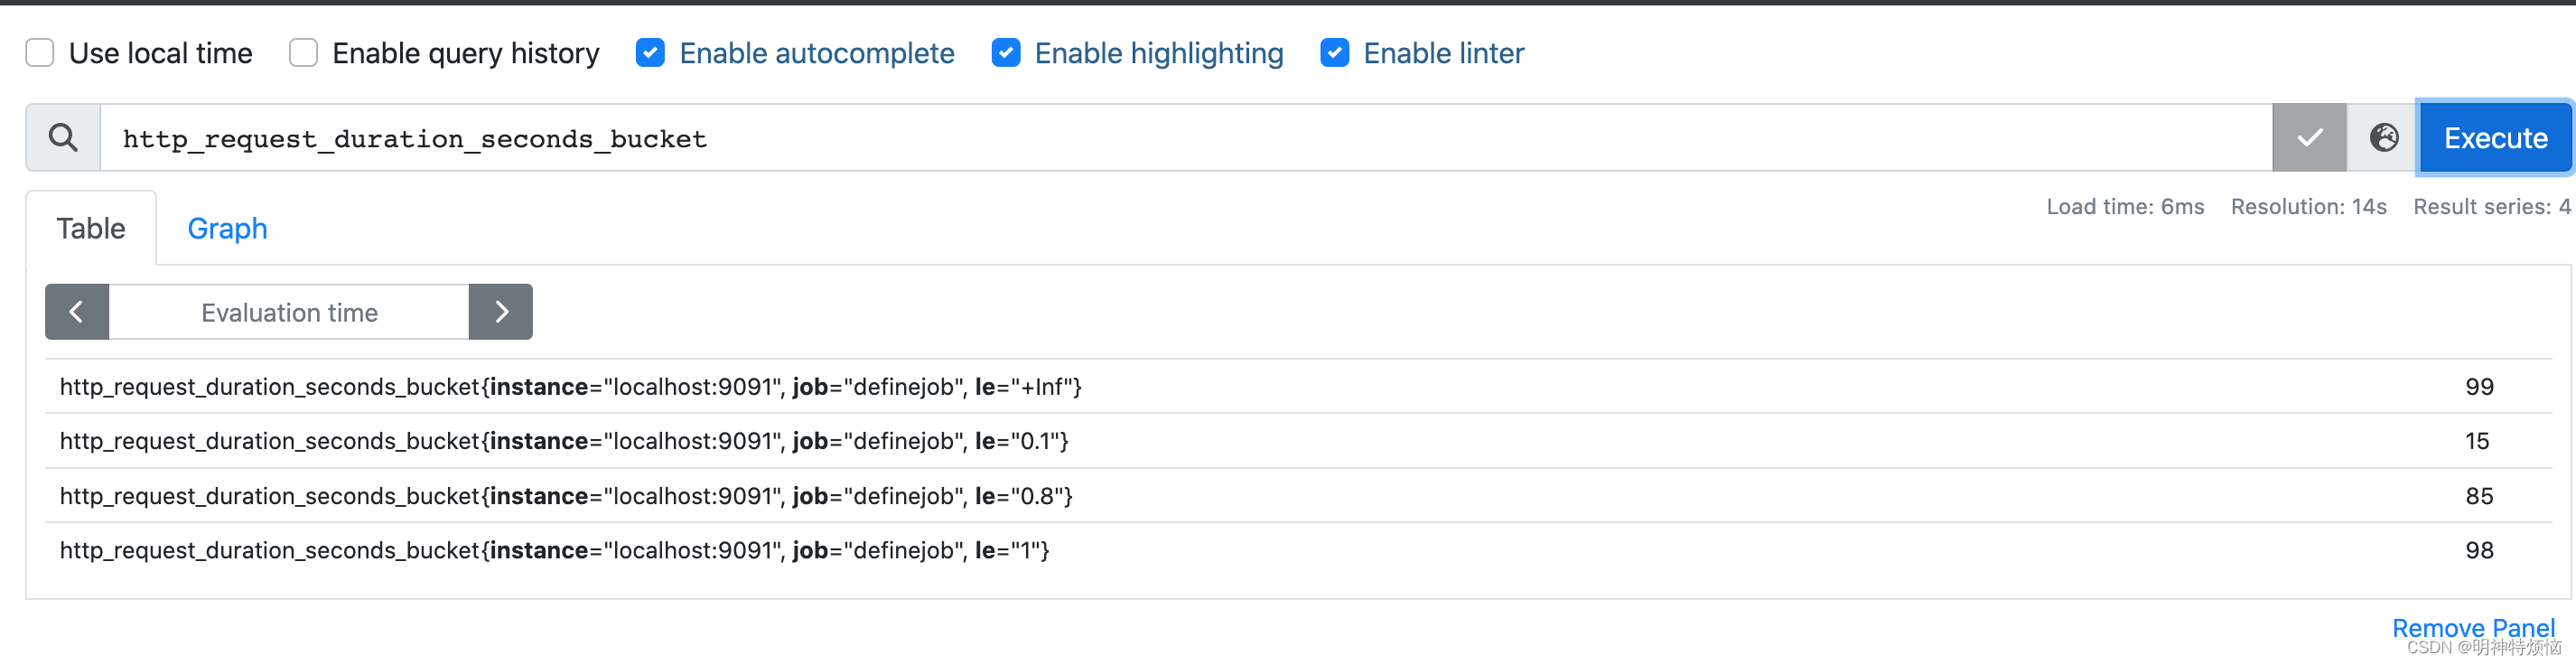
Histogram会生成三类汇总数据
- 指标名字_bucket bucket 的累计计数器
- 指标名字_sum 观测值总和
- 指标名字_count 抓取总样本量
查看桶数据
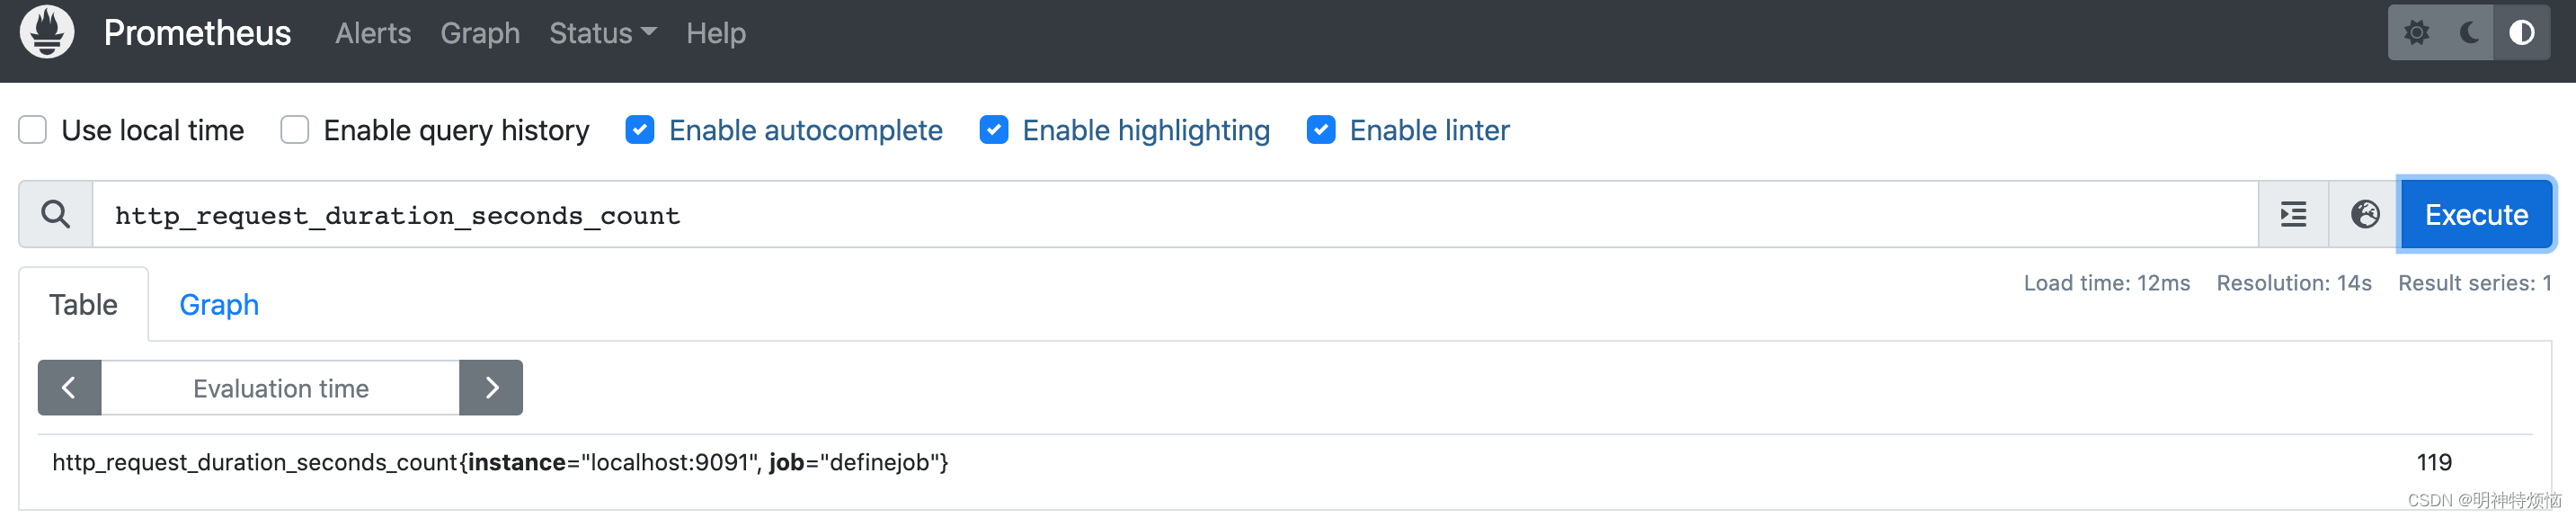
查看抓取总数
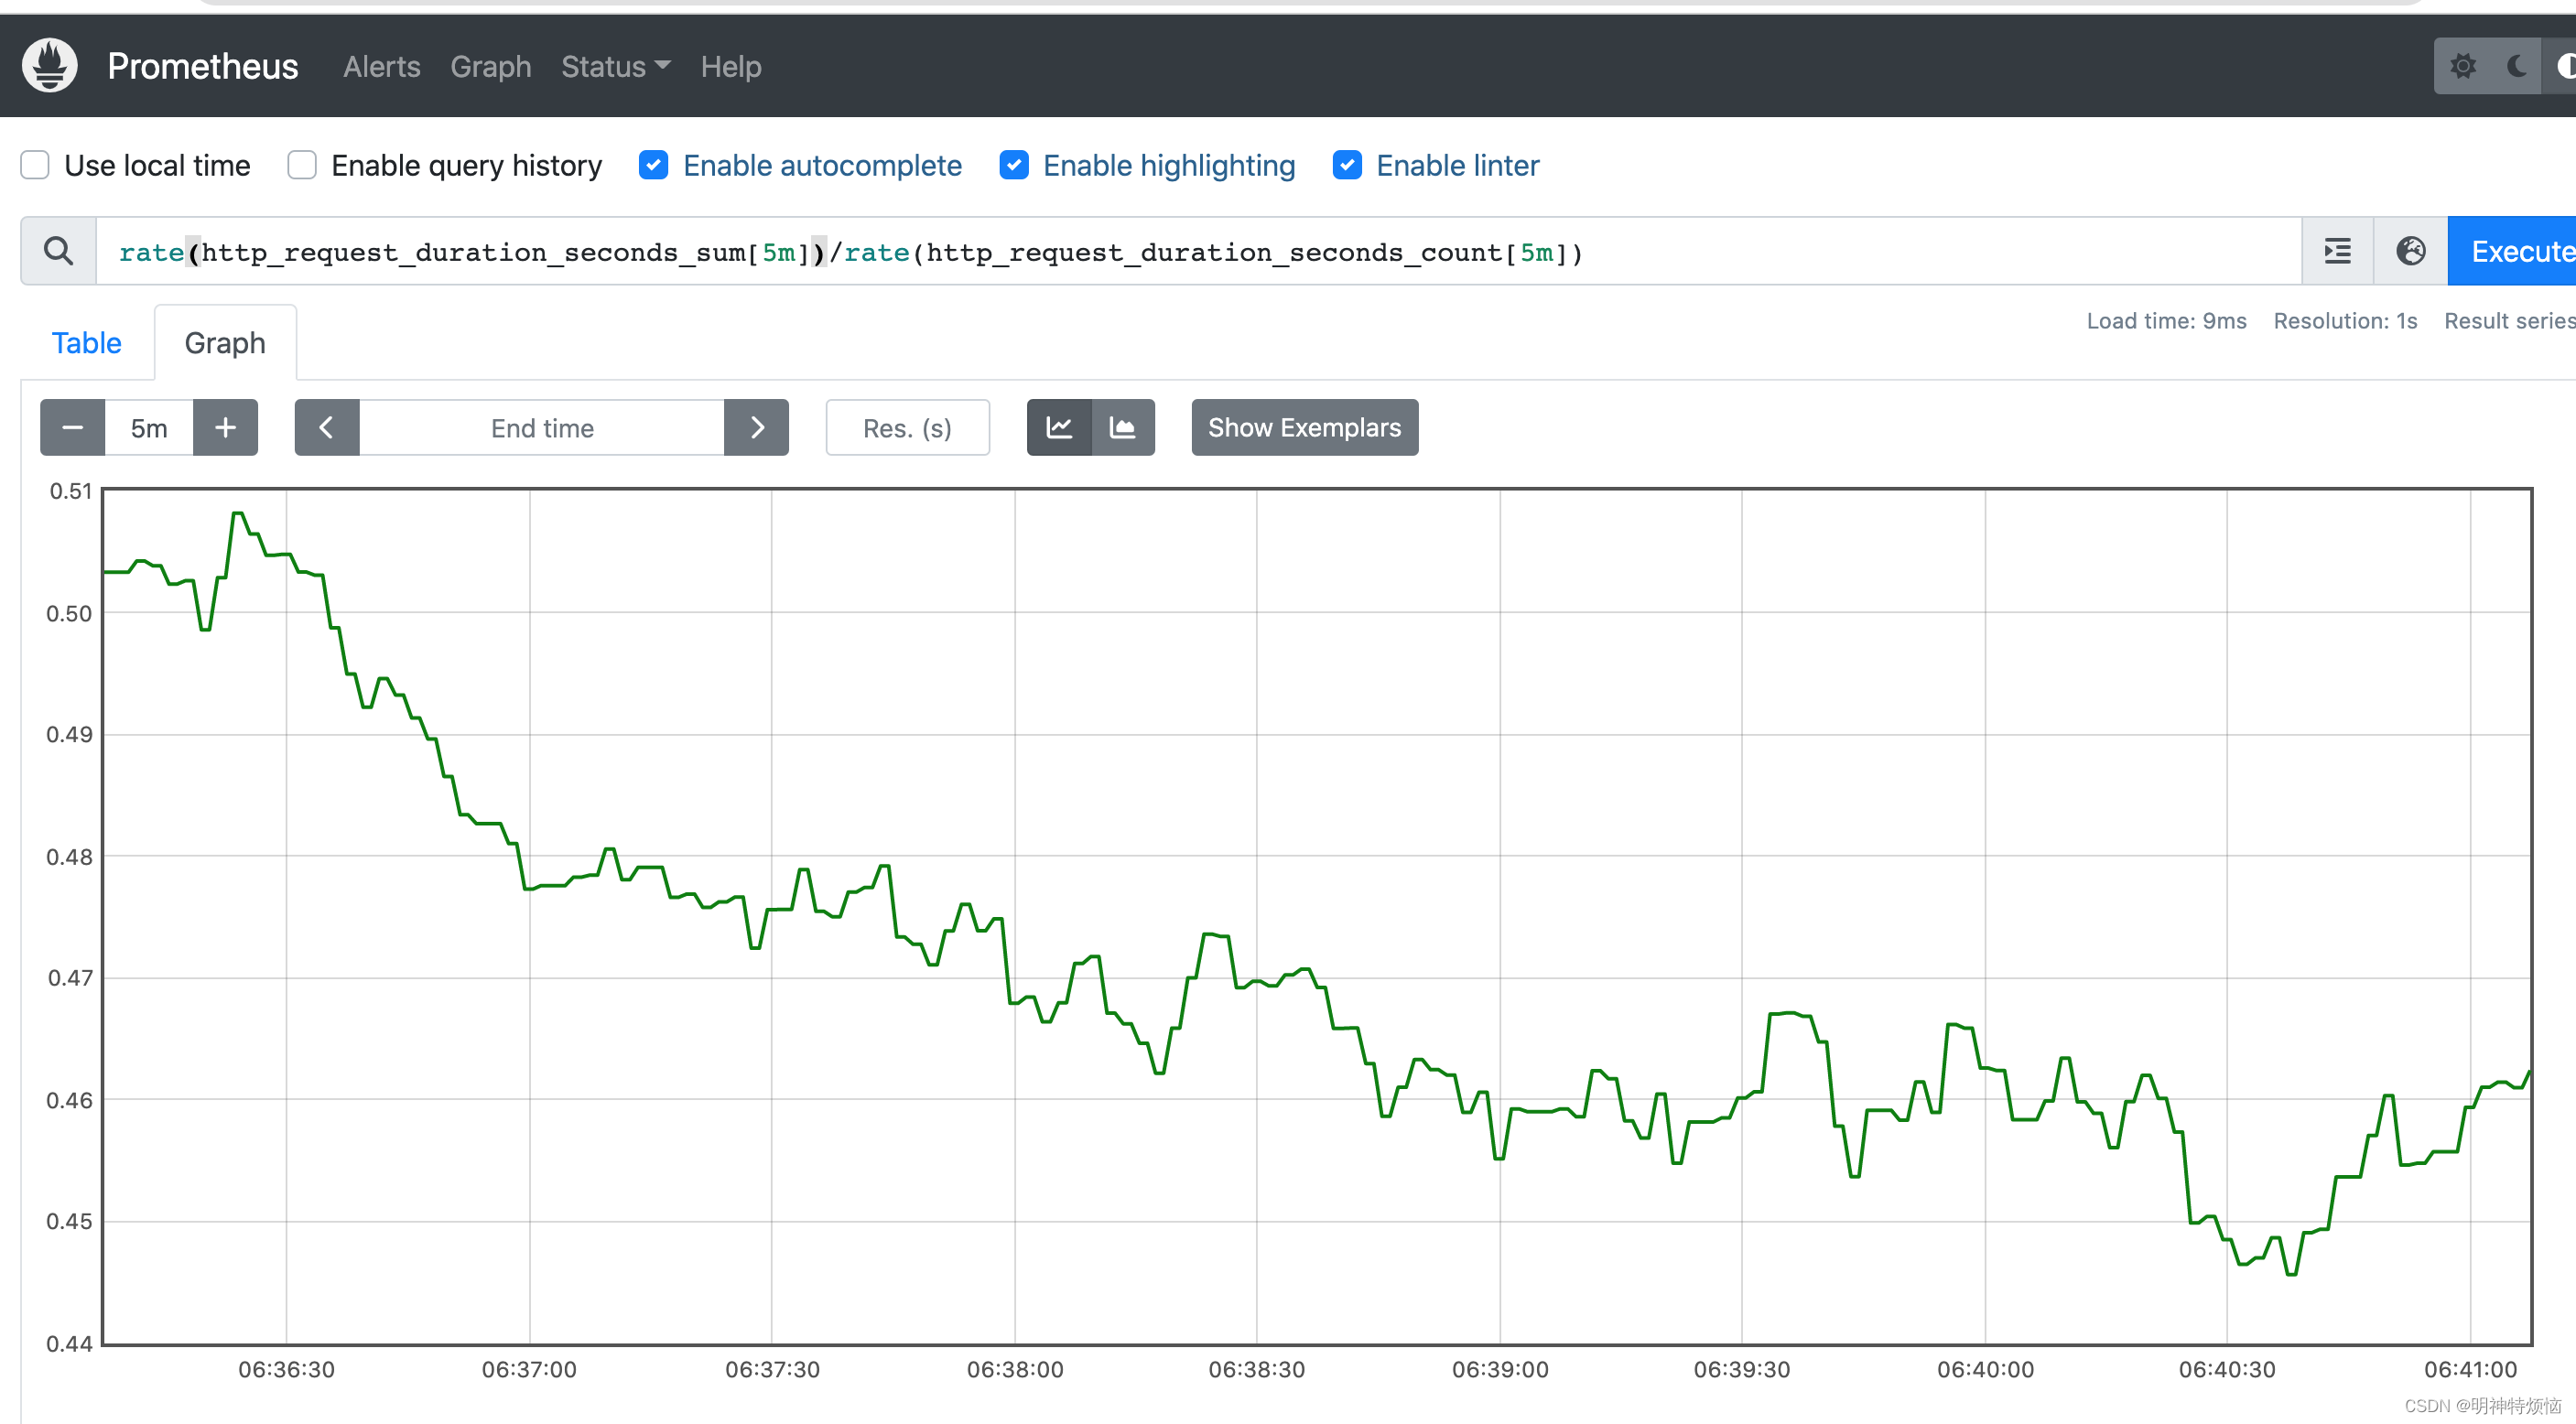
查看每秒钟平均响应时间
rate(http_request_duration_seconds_sum[5m])/rate(http_request_duration_seconds_count[5m])
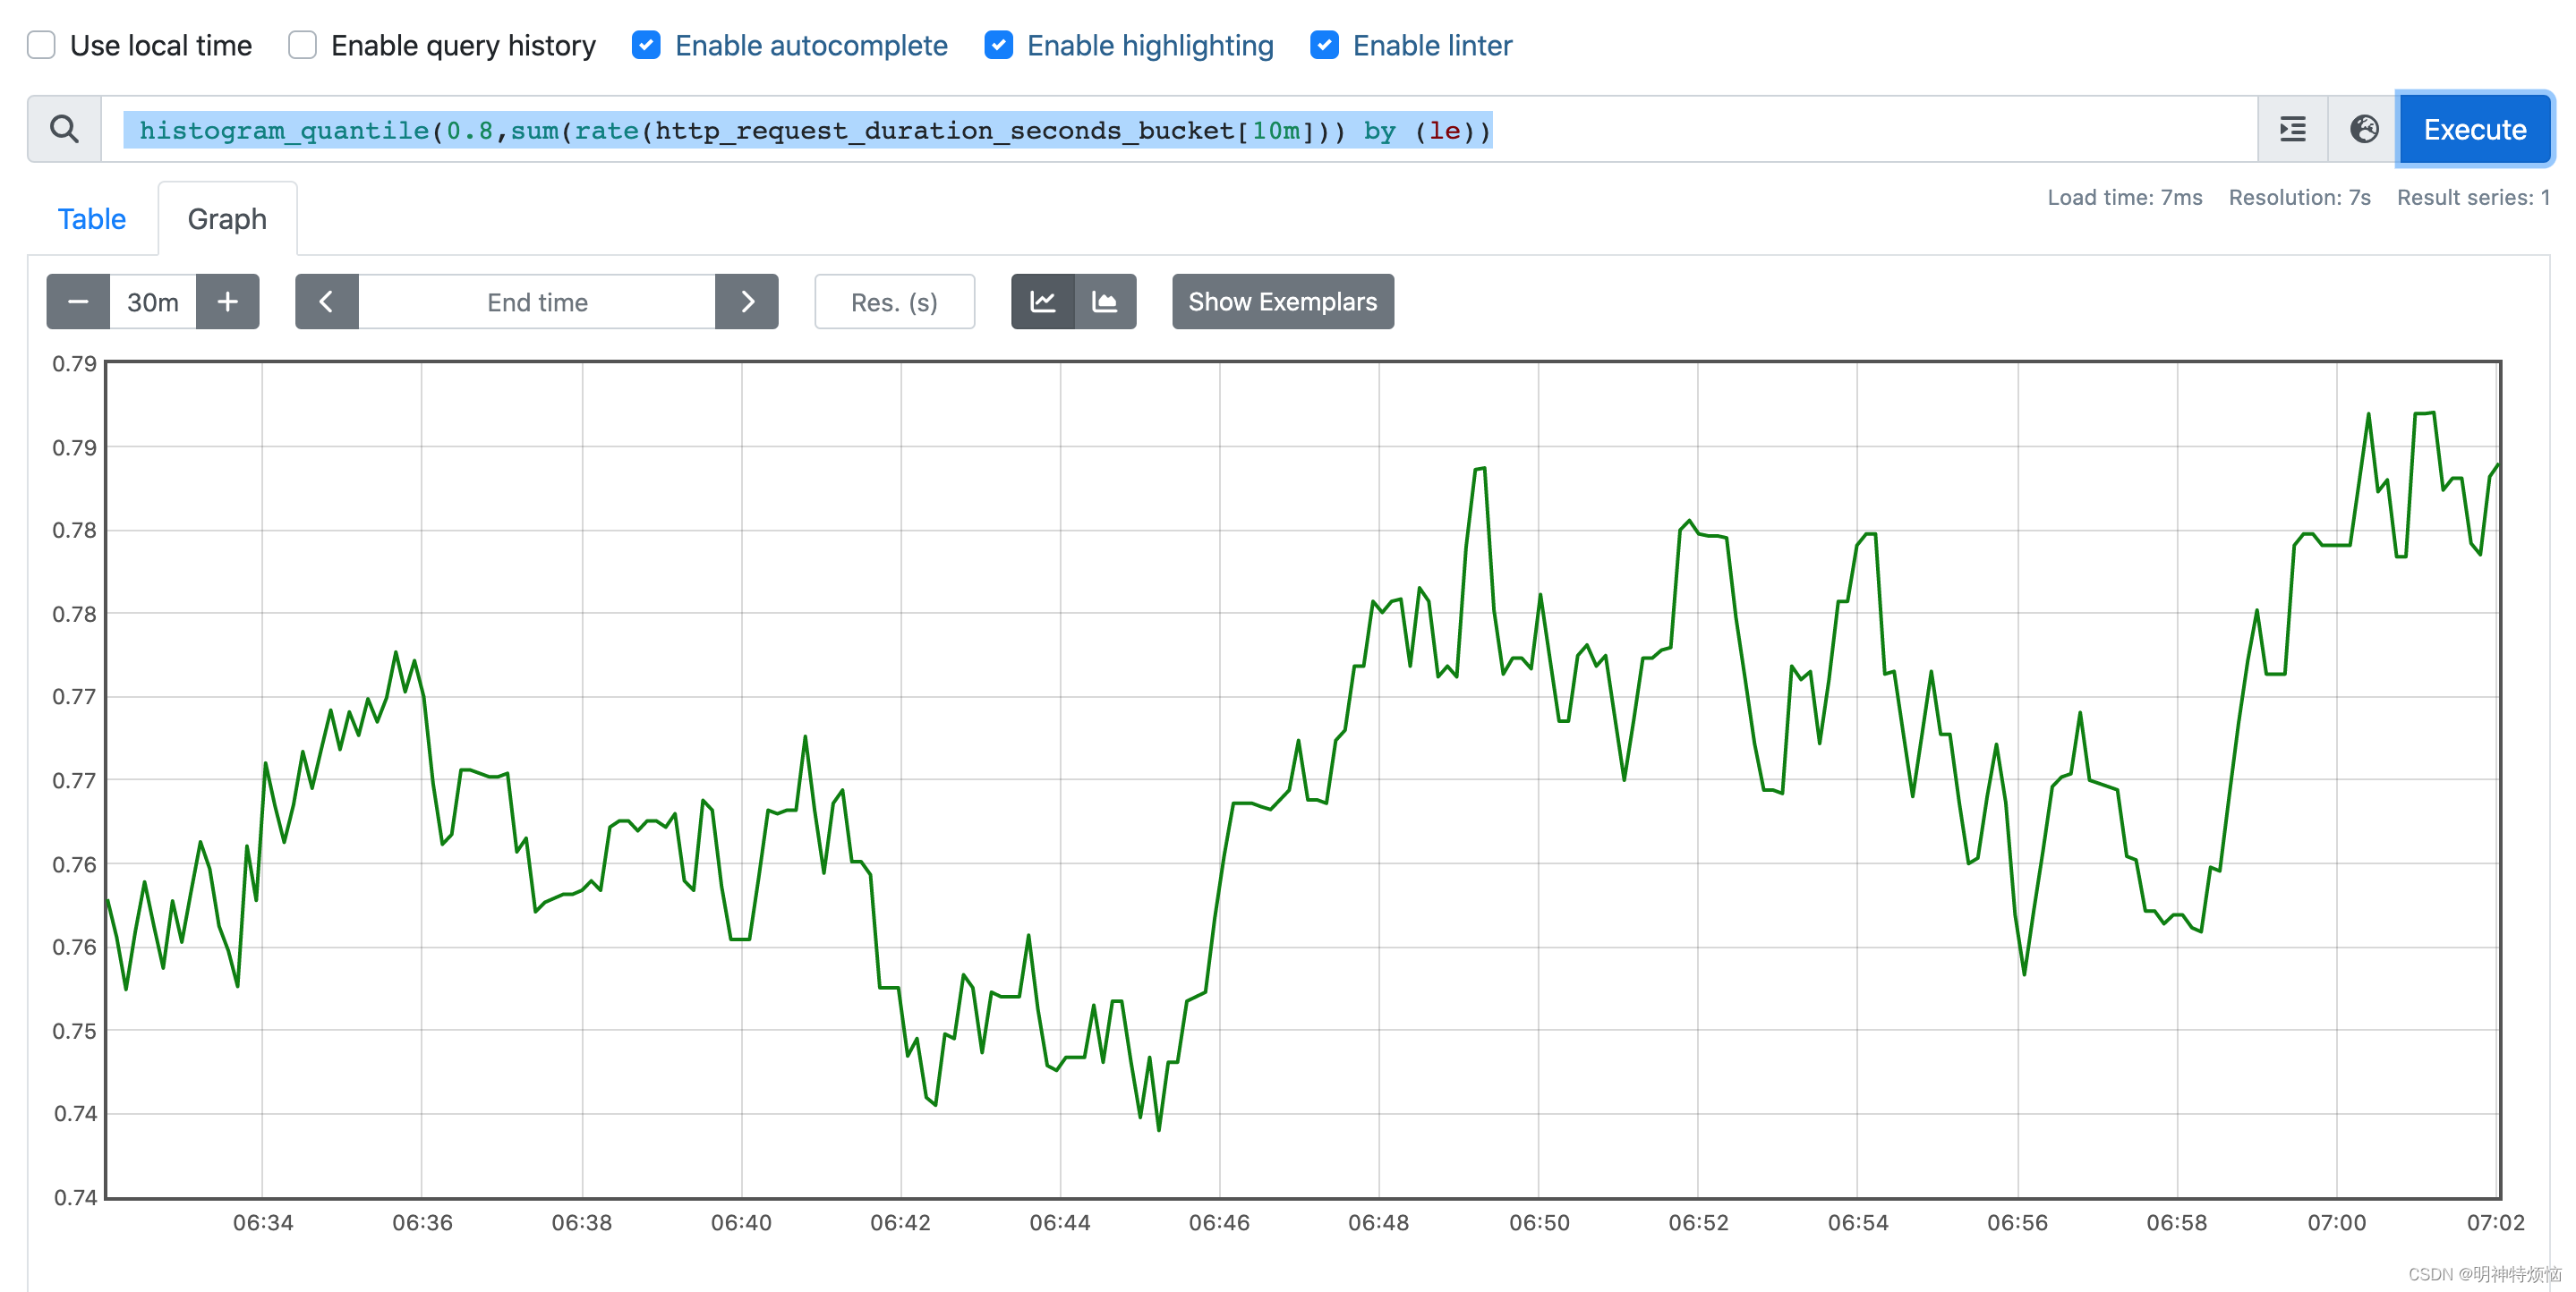
分位数
通过上面我们我们了解到,每个桶内的数据总量,很容易可以得出我们要的99%的请求响应时间在哪个桶里,假设有100个请求,其中第99个在最后一个桶,可是这个桶是记录800 ~ 1000毫秒范围,可我们并不知道排序第99的请求具体是多少毫秒,直方图假设800 ~ 1000毫秒桶是线性存储,来估算响应时间。
统计95分位,即95%的请求的响应时间。
histogram_quantile(0.95,sum(rate(http_request_duration_seconds_bucket[10m])) by (le))
4)Summary
摘要,专门为精确计算分位存在。这里不详述,详情可见https://blog.csdn.net/hanjinjuan/article/details/121228892。