
Prometheus主要用于监控,在前面介绍安装和设定方法的使用配置了配置抓取Prometheus自身的方式用于验证。这篇文章则使用Prometheus官方所提供的一个go语言的demo示例用于生成监控目标数据,然后使用Prometheus进行数据的监控与显示。
事前准备
Prometheus可以对各种指标数据进行监控,首先准备用于提供监控数据的应用程序。
准备应用
执行命令:git clone https://github.com/prometheus/client_golang.git
启动Docker容器进行编译
启动Docker并将待编译的工程进行卷的映射
执行命令示例:docker run --rm -it -v `pwd`/client_golang:/go/src liumiaocn/golang:1.13.5-alpine3.11 sh -c ‘cd /go/src/examples/random && go get -d && go build && ls -l random’
liumiaocn:golang liumiao$ docker run --rm -it -v `pwd`/client_golang:/go/src liumiaocn/golang:1.13.5-alpine3.11 sh -c 'cd /go/src/examples/random && go get -d && go build && ls -l random'
go: downloading github.com/prometheus/common v0.7.0
go: downloading github.com/prometheus/client_model v0.1.0
go: extracting github.com/prometheus/client_model v0.1.0
go: downloading github.com/golang/protobuf v1.3.2
go: extracting github.com/prometheus/common v0.7.0
go: downloading github.com/matttproud/golang_protobuf_extensions v1.0.1
go: downloading golang.org/x/sys v0.0.0-20191220142924-d4481acd189f
go: downloading github.com/cespare/xxhash/v2 v2.1.1
go: downloading github.com/prometheus/procfs v0.0.8
go: downloading github.com/beorn7/perks v1.0.1
go: extracting github.com/golang/protobuf v1.3.2
go: extracting github.com/cespare/xxhash/v2 v2.1.1
go: extracting github.com/matttproud/golang_protobuf_extensions v1.0.1
go: extracting github.com/beorn7/perks v1.0.1
go: extracting github.com/prometheus/procfs v0.0.8
go: extracting golang.org/x/sys v0.0.0-20191220142924-d4481acd189f
go: finding github.com/prometheus/client_model v0.1.0
go: finding github.com/prometheus/common v0.7.0
go: finding github.com/beorn7/perks v1.0.1
go: finding github.com/cespare/xxhash/v2 v2.1.1
go: finding github.com/golang/protobuf v1.3.2
go: finding github.com/prometheus/procfs v0.0.8
go: finding github.com/matttproud/golang_protobuf_extensions v1.0.1
-rwxr-xr-x    1 root     root      11818840 Jan  2 05:41 random
liumiaocn:golang liumiao$
启动监控对象进程
分别在8080-8082三个端口启动三个服务用于提供Prometheus监控的对象进程。
执行命令:docker run -p 8080:8080 -d -v `pwd`/random:/random -it --rm alpine /random -listen-address=:8080
执行命令:docker run -p 8081:8081 -d -v `pwd`/random:/random -it --rm alpine /random -listen-address=:8081
执行命令:docker run -p 8082:8082 -d -v `pwd`/random:/random -it --rm alpine /random -listen-address=:8082
liumiaocn:random liumiao$ docker run -p 8080:8080 -d -v `pwd`/random:/random -it --rm alpine /random -listen-address=:8080
22da3e4803b8fc7b31b0ebb7b8eac0afc188c62bfc1e1ae58f26ebf56178f3b8
liumiaocn:random liumiao$ docker run -p 8081:8081 -d -v `pwd`/random:/random -it --rm alpine /random -listen-address=:8081
ed35547ffb865df313236adab20d0c20164f051a45df9f59c93df6e1ddaec4b6
liumiaocn:random liumiao$ docker run -p 8082:8082 -d -v `pwd`/random:/random -it --rm alpine /random -listen-address=:8082
4e7da2844b26b67b41ad43b52673fccb95d7631c88906d3dff1f244dff62a43e
liumiaocn:random liumiao$
结果确认:容器状态确认
liumiaocn:random liumiao$ docker ps
CONTAINER ID        IMAGE               COMMAND                  CREATED             STATUS              PORTS                    NAMES
4e7da2844b26        alpine              "/random -listen-add…"   2 seconds ago       Up 1 second         0.0.0.0:8082->8082/tcp   ecstatic_hypatia
ed35547ffb86        alpine              "/random -listen-add…"   10 seconds ago      Up 9 seconds        0.0.0.0:8081->8081/tcp   blissful_jennings
22da3e4803b8        alpine              "/random -listen-add…"   21 seconds ago      Up 20 seconds       0.0.0.0:8080->8080/tcp   nervous_bell
liumiaocn:random liumiao$
结果确认:指标确认
liumiaocn:random liumiao$ curl http://localhost:8080/metrics 2>/dev/null |wc -l
     164
liumiaocn:random liumiao$ curl http://localhost:8081/metrics 2>/dev/null |wc -l
     164
liumiaocn:random liumiao$ curl http://localhost:8082/metrics 2>/dev/null |wc -l
     164
liumiaocn:random liumiao$
配置Prometheus
现在我们在8080-8082三个端口都提供了可供Prometheus进行监控指标数据,将Prometheus进行如下配置:
liumiaocn:config liumiao$ cat prometheus-random.yml
scrape_configs:
  - job_name:       'example-random'

    # Override the global default and scrape targets from this job every 5 seconds.
    scrape_interval: 5s

    static_configs:
      - targets: ['192.168.31.242:8080', '192.168.31.242:8081']
        labels:
          group: 'production'

      - targets: ['192.168.31.242:8082']
        labels:
          group: 'canary'
liumiaocn:config liumiao$
配置说明:
- 设定job名称为example-random
- 数据的抓取时间间隔设定为5秒
- 将8080-8082三个监控对象分成两组,8080和8081一组,组标签名称为production,8082为一组,组标签名称为canary
- ip(192.168.31.242)请修改为自己的IP,因为本文启动的内容均在容器之中,又没有使用link或者其他方式来使得各个容器之间的相互联通,这里直接使用IP方式使得Prometheus能够访问到这些对象机器。
启动Prometheus服务
使用如下命令启动Prometheus服务
liumiaocn:config liumiao$ docker run -d -p 9090:9090 -v `pwd`/prometheus-random.yml:/etc/prometheus/prometheus.yml --name prometheus prom/prometheus
1f9d3831c1d2c85d758cb4ff8af3054ec90a7f7b8f1f356431150ce6822253df
liumiaocn:config liumiao$
确认Promtheus容器状态
liumiaocn:config liumiao$ docker ps |grep prometheus
1f9d3831c1d2        prom/prometheus     "/bin/prometheus --c…"   About a minute ago   Up 59 seconds       0.0.0.0:9090->9090/tcp   prometheus
liumiaocn:config liumiao$
结果确认
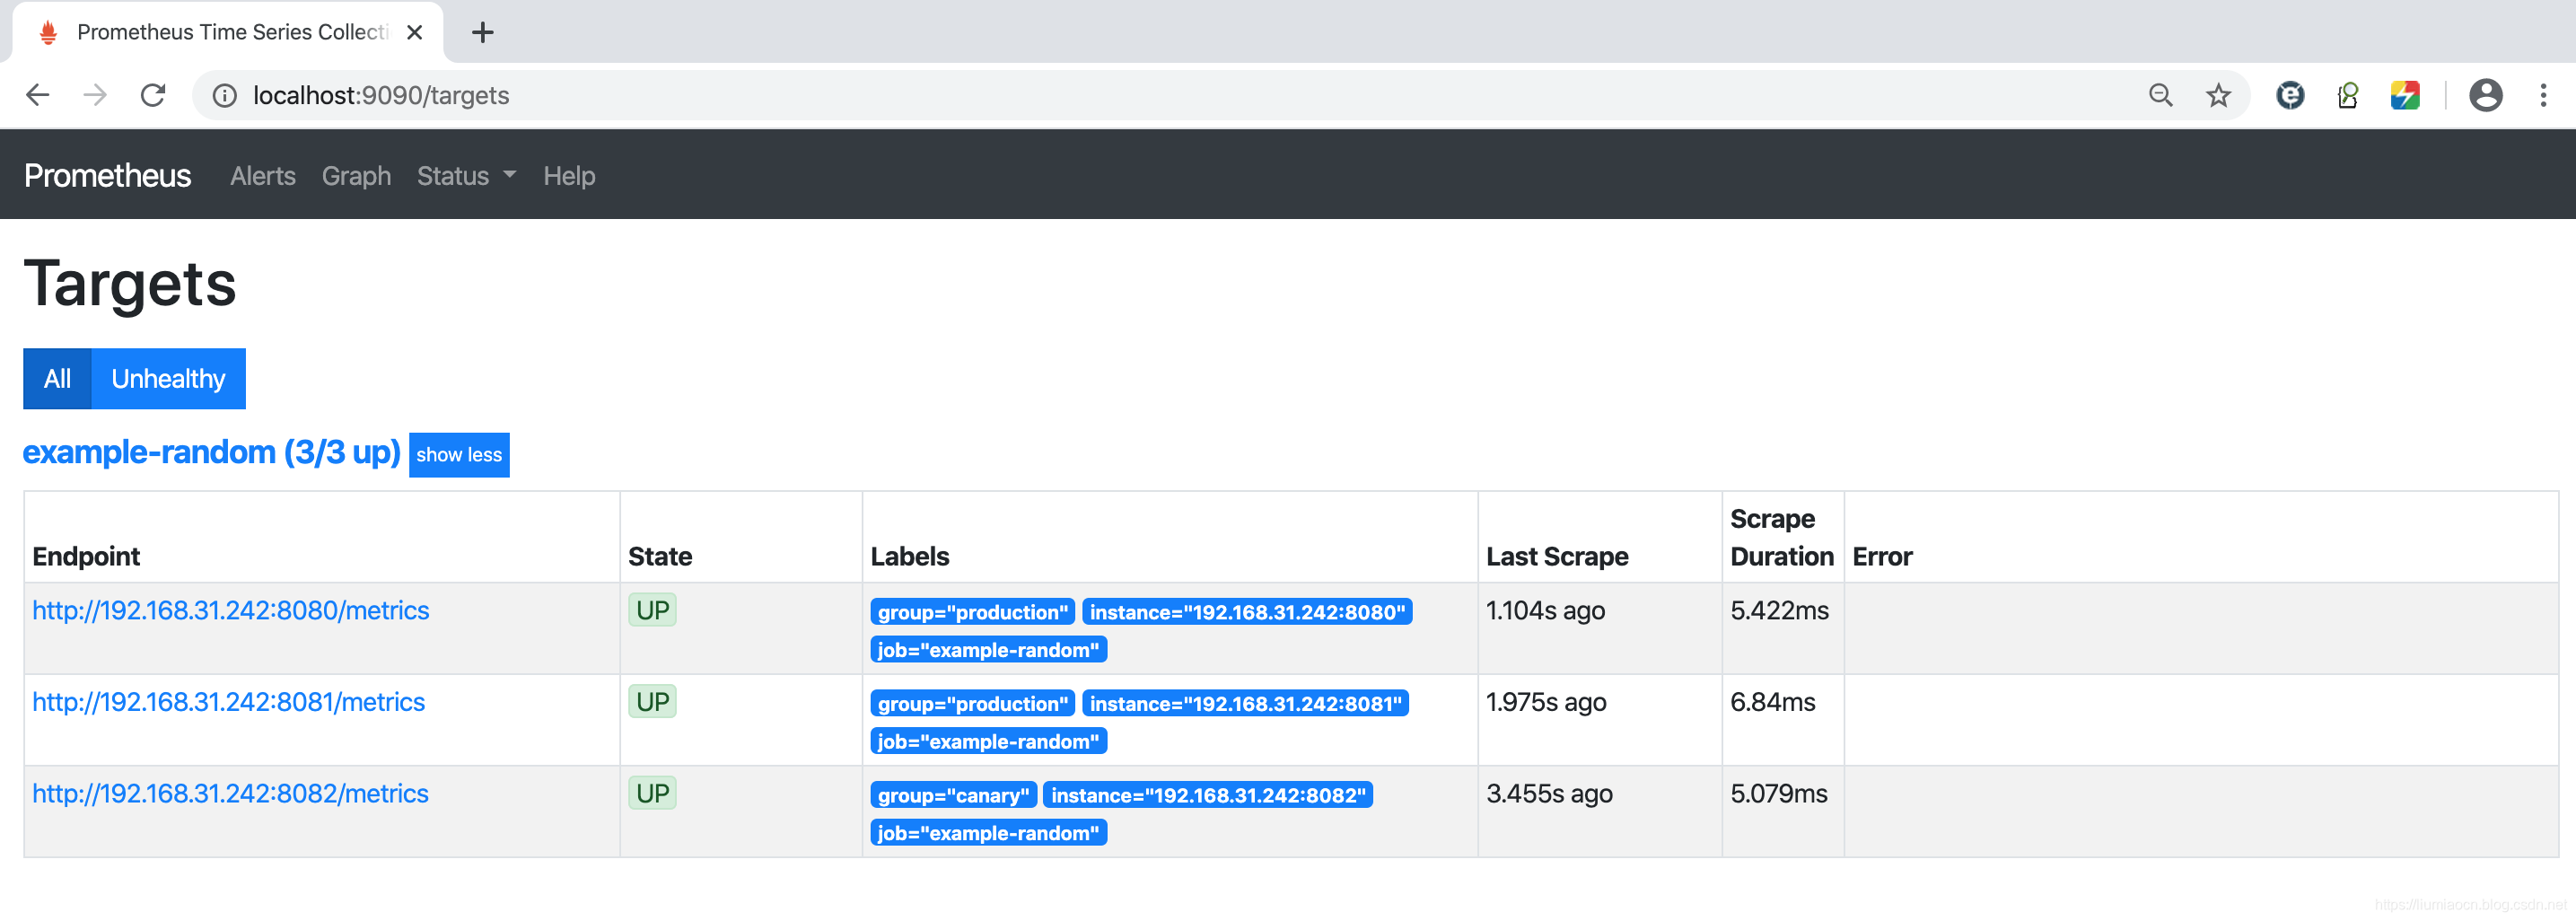
确认连接状态
Prometheus从8080-8082的端口获取监控数据,而这些连接是否正常,可以从如下界面进行确认
获取的指标信息

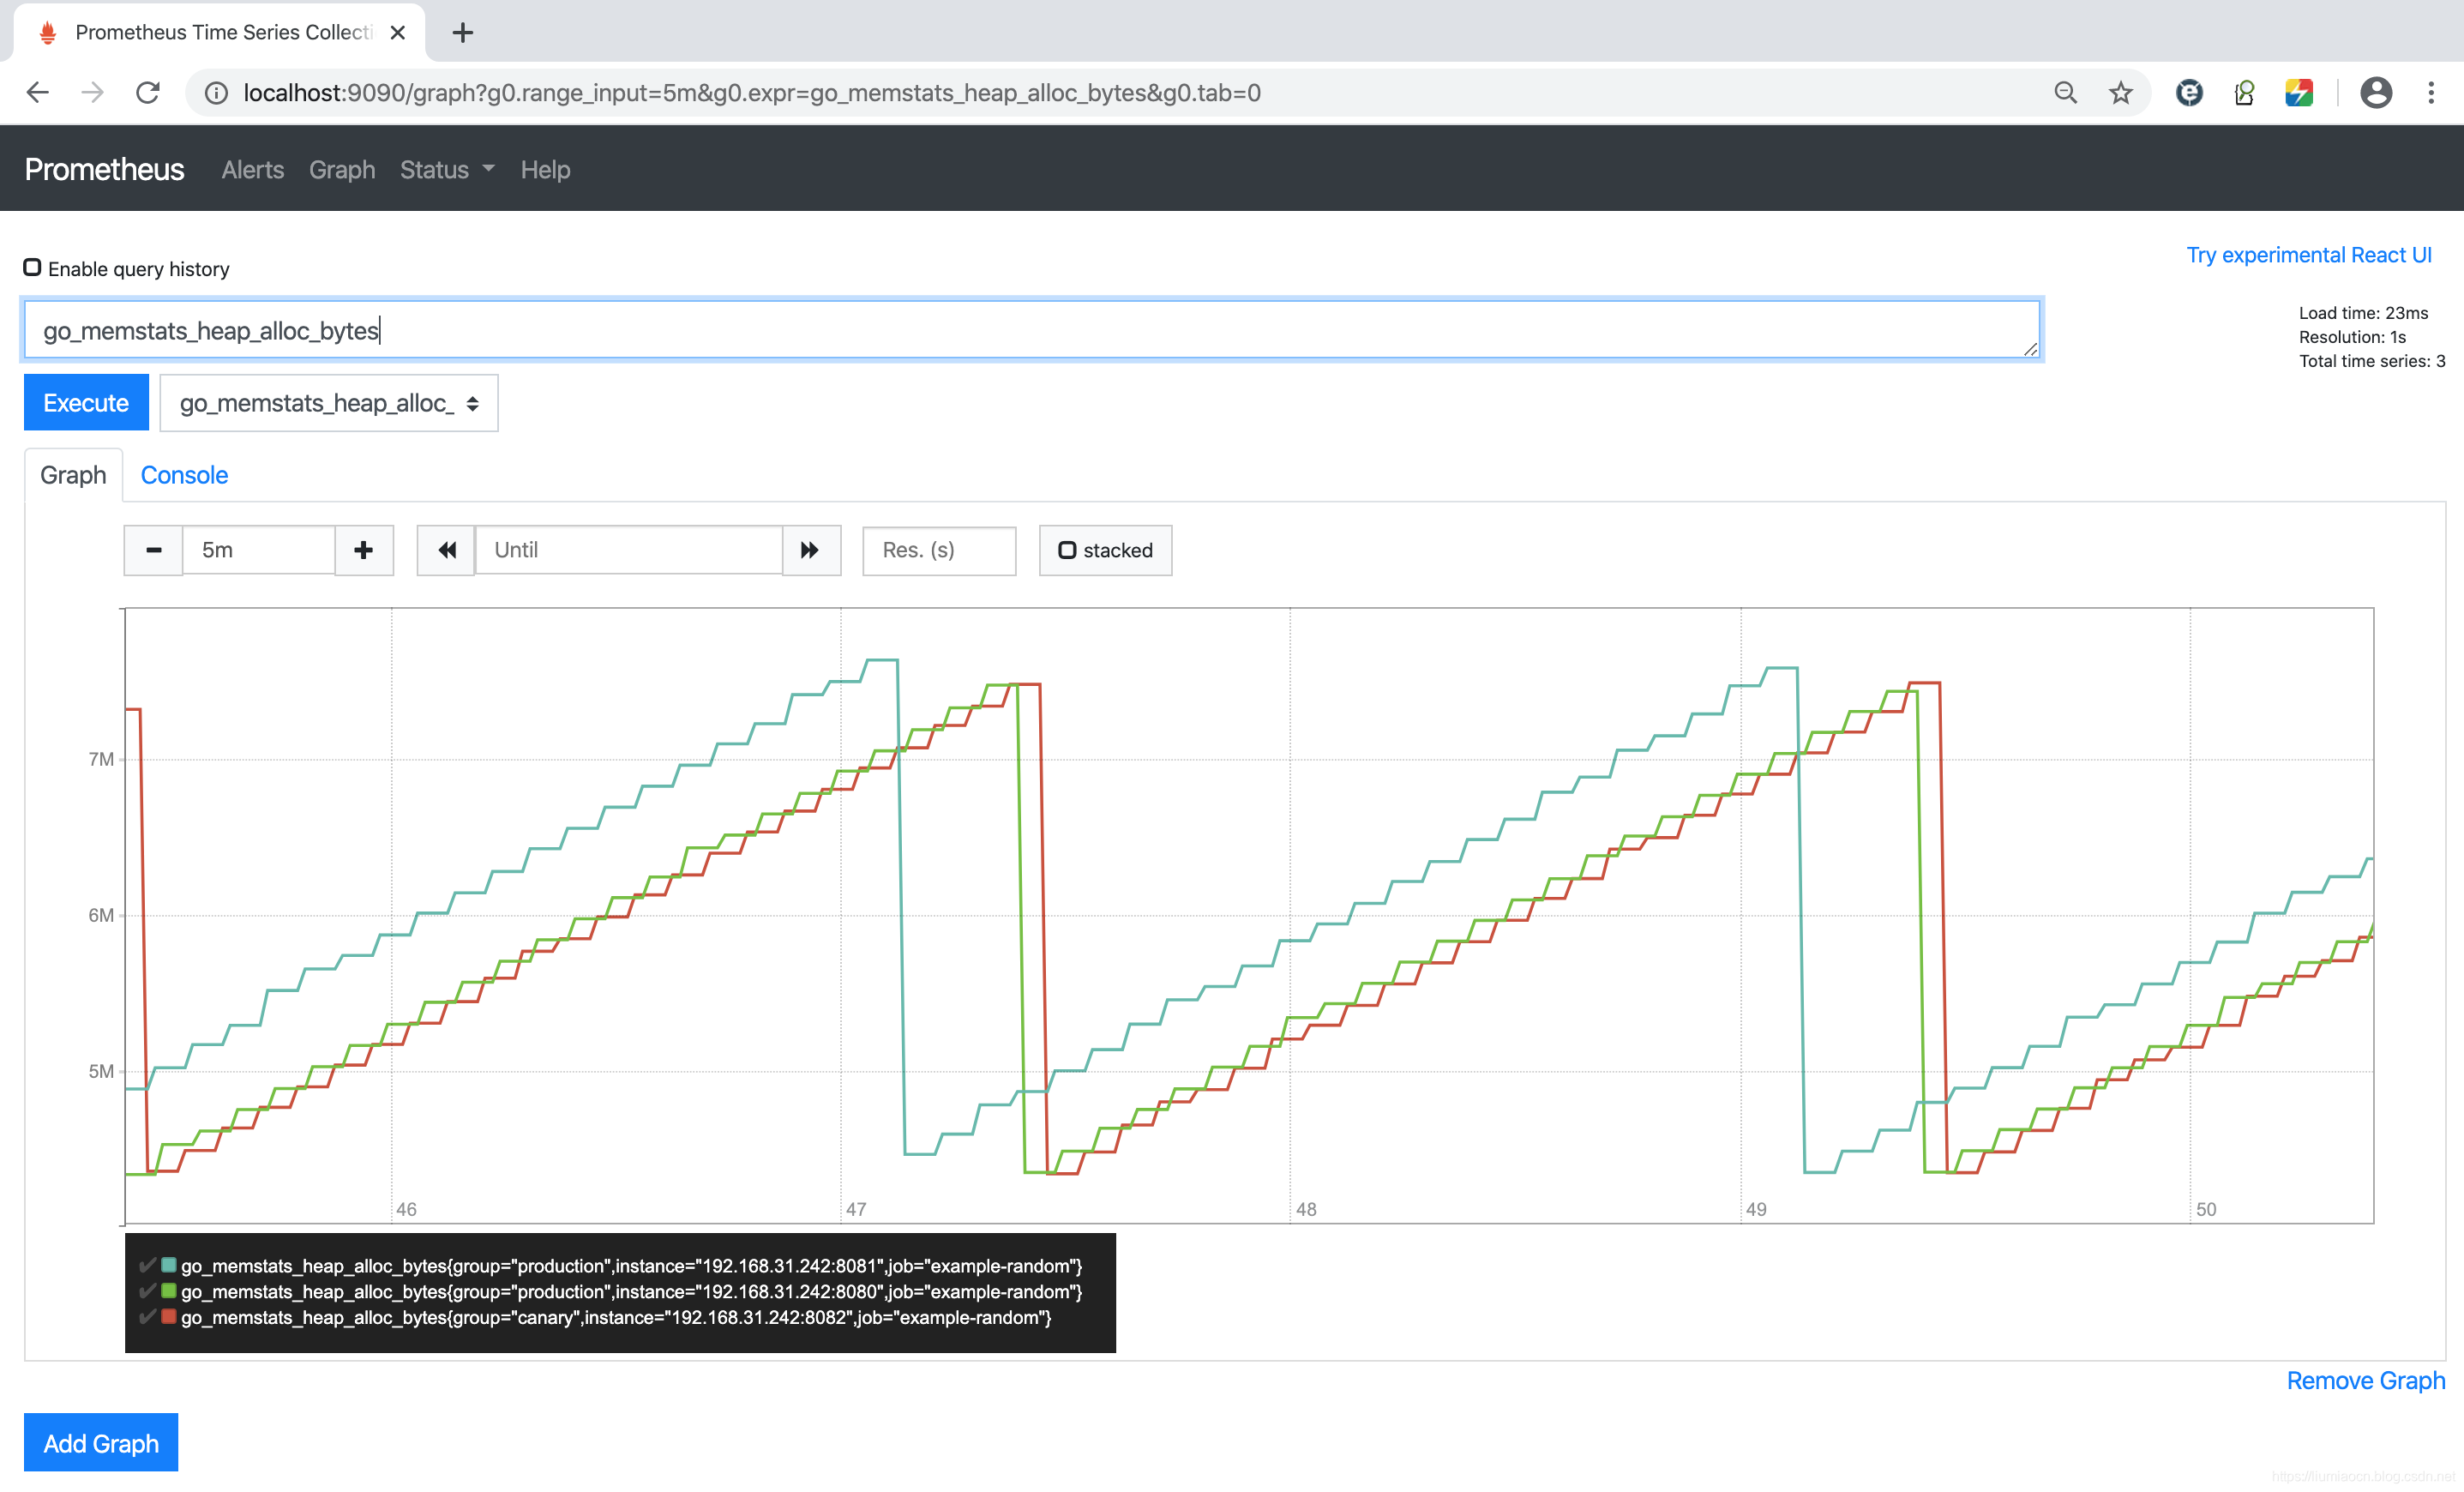
查看某一指标的实时状况
Prometheus也具有一点可视化的能力,比如可以直接确认选中的某项指标的一定时间段(缺省1个小时,这里选择为5分钟)的变化情况
参考内容
https://prometheus.io/docs/prometheus/latest/getting_started/
