1. 问题描述和分析
# 方法一:采用此方法设置横纵坐标标签时零点均在原点,且相交
plt.xlim(0,1)
plt.ylim(0,160)
# 方法二:采用此方法设置横纵坐标标签时,零点不在原点,不相交
plt.xticks([0, 0.25, 0.50, 0.75, 1.0], fontproperties = 'Times New Roman', size = 78)
plt.yticks([0, 40, 80, 120, 160],fontproperties = 'Times New Roman', size = 78)
- 方法一:
优势:零点均在原点,且相交
缺点:不能控制坐标轴标签间距 - 方法二:
优势:可以随意控制标签间距多少
缺点:零点不在原点,不相交
2. 解决办法
可以通过axis函数解决,如下:
plt.xticks([0, 0.25, 0.50, 0.75, 1.0], fontproperties = 'Times New Roman', size = 78)
plt.yticks([0, 40, 80, 120, 160],fontproperties = 'Times New Roman', size = 78)
plt.axis([0, 1, 0, 160])
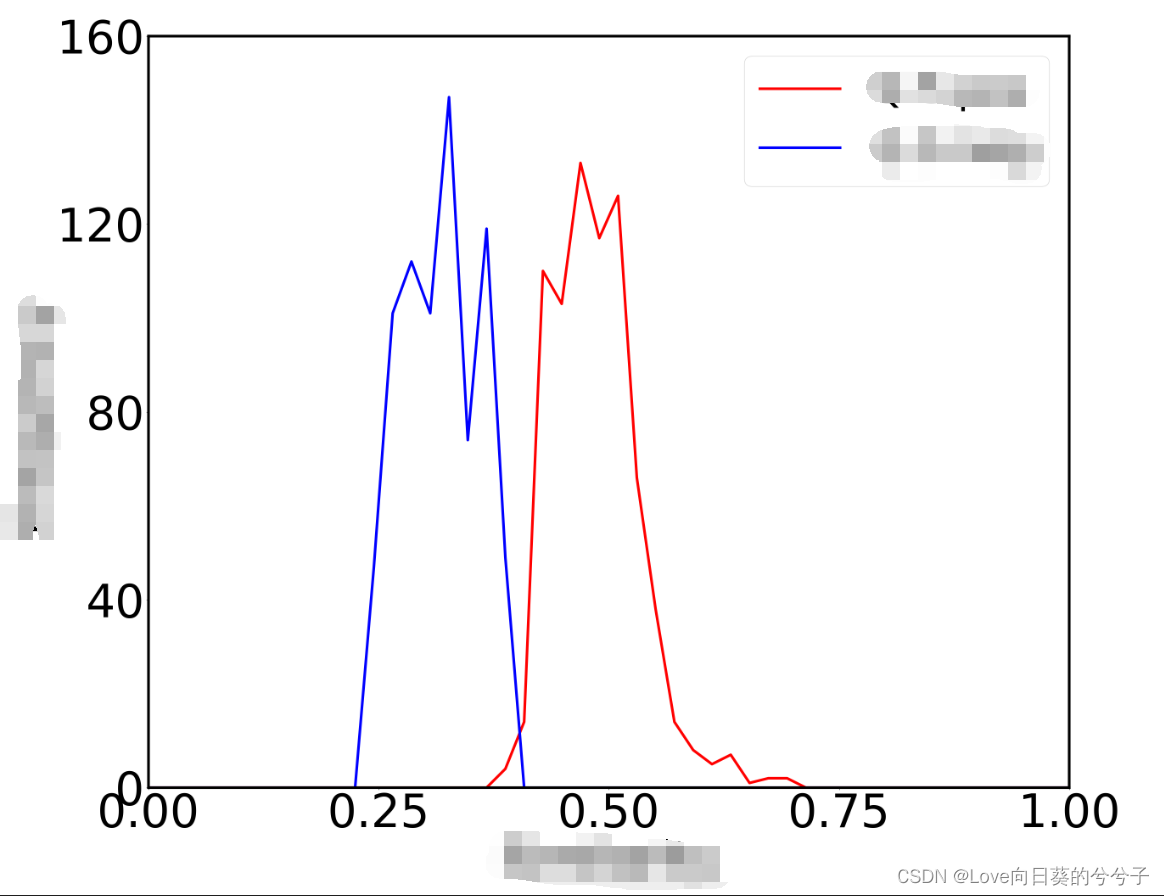
结果如图: