option_column: {
color: ['#9D509F'],
grid: {
left: '0',
right: '0',
bottom: '0',
top: '0',
containLabel: false
},
xAxis: [
{
type: 'category',
boundaryGap: false,
data: ['Mon', 'Tue', 'Wed', 'Thu', 'Fri', 'Sat', 'Sun'],
show: true
}
],
yAxis: [
{
show: false,
axisLine:{
show:false
},
axisTick:{
show:false
},
splitLine:{
show:false
}
}
],
series: [
{
type: 'line',
stack: 'Total',
smooth: true,
lineStyle: {
width: 0
},
showSymbol: false,
areaStyle: {
opacity: 0.8,
color: '#9D509F'
},
emphasis: {
focus: 'series'
},
data: [140, 232, 101, 264, 90, 340, 250]
},
]
}

option_column: {
grid: {
left: '0',
right: '0',
bottom: '0',
top: '0',
containLabel: false
},
xAxis: {
show: false,
type: 'category',
data: ['1','2','3','4','5','6','7','8','9','10','11','12','13','14']
},
yAxis: {
show: false,
type: 'value'
},
series: [
{
itemStyle: {
color: '#2D8BD2'
},
data: [120, 160, 150, 80, 70, 110, 130,200,300,250,120,50,180,30],
type: 'bar',
}
]
}

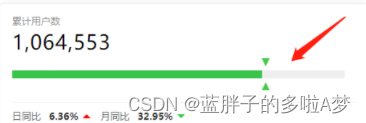
option_column: {


  grid: {


    left: '0',
    right: '0',
    bottom: '0',
    top: '0',
    containLabel: false
  },
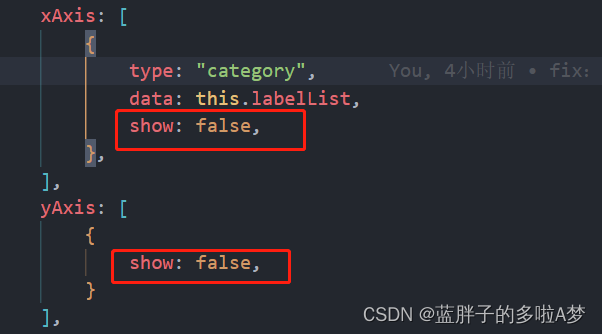
  xAxis: {


    show: false,
    type: 'value',
    boundaryGap: false
  },
  yAxis: {


    show: false,
    type: 'category',
    data: ['Brazil']
  },
  series: [
    {


      type: 'bar',
      data: [18203],
      stack: 'sear',
      itemStyle: {


        color: '#39C44A'
      },
      barWidth: 10
    },
    {


      type: 'bar',
      data: [6000],
      stack: 'sear',
      itemStyle: {


        color: '#EEEEEE'
      },
      barWidth: 10
    },
    {


      type: 'custom',
      stack: '总量',
      data: [100],
      renderItem: (params, api) => {


        const value = api.value(0)
        const endPoint = api.coord([value, 0])

        return {


          type: 'group',
          position: endPoint,
          children: [{


            type: 'path',
            shape: {


              d: 'M1024 255.996 511.971 767.909 0 255.996 1024 255.996z',
              x: 310,
              y: -20,
              width: 10,
              height: 10,
              layout: 'cover'
            },
            style: {


              fill: '#45c946'
            }
          }, {


            type: 'path',
            shape: {


              d: 'M0 767.909l512.029-511.913L1024 767.909 0 767.909z',
              x: 310,
              y: 10,
              width: 10,
              height: 10,
              layout: 'cover'
            },
            style: {


              fill: '#45c946'
            }
          }]
        }
      }
    }
  ]
}

需求 效果实现


