移动前:

我们有两种方法可以实现这个目标:
import warnings
warnings.filterwarnings('ignore')
import numpy as np
import matplotlib.pyplot as plt
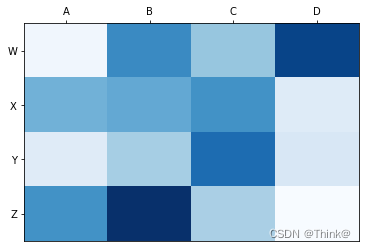
column_labels = list('ABCD')
row_labels = list('WXYZ')
data = np.random.rand(4, 4)
fig, ax = plt.subplots()
heatmap = ax.pcolor(data, cmap=plt.cm.Blues)
# put the major ticks at the middle of each cell
ax.set_xticks(np.arange(data.shape[1]) + 0.5, minor=False)
ax.set_yticks(np.arange(data.shape[0]) + 0.5, minor=False)
# want a more natural, table-like display
# Method 1:
ax.invert_yaxis()
ax.xaxis.tick_top()
# Method 2:
# ax.xaxis.set_ticks_position('top')
ax.set_xticklabels(column_labels, minor=False)
ax.set_yticklabels(row_labels, minor=False)
plt.show()
plt.clf()移动后: