1. 介绍
Doris的FE和BE通过http端口metrics路径,将监控数据暴露出来,以key-value的文本形式对外展现,每个key还可能有不同的Label加以区分。Prometheus再从Doris拉取监控数据
- http://fe_host:fe_http_port/metrics
- http://be_host:be_webserver_port/metrics
2. Prometheus和Grafana的简单使用
Prometheus的简单使用可以参考:Prometheus部署Prometheus Server、Pushgateway、Node exporter、AlertManager
Grafana的简单使用可以参考:Prometheus集成Grafana(手动创建/通过模板创建Dashboard)
3. 配置Prometheus的prometheus.yml
添加内容如下:
scrape_configs:
......省略部分......
  # 添加Apache Doris集群的监控
  - job_name: 'doris_monitor'
    static_configs:
      - targets: ['doris1:7030', 'doris2:7030', 'doris3:7030']
        labels:
          group: fe
      - targets: ['doris1:7020', 'doris2:7020', 'doris3:7020']
        labels:
          group: be
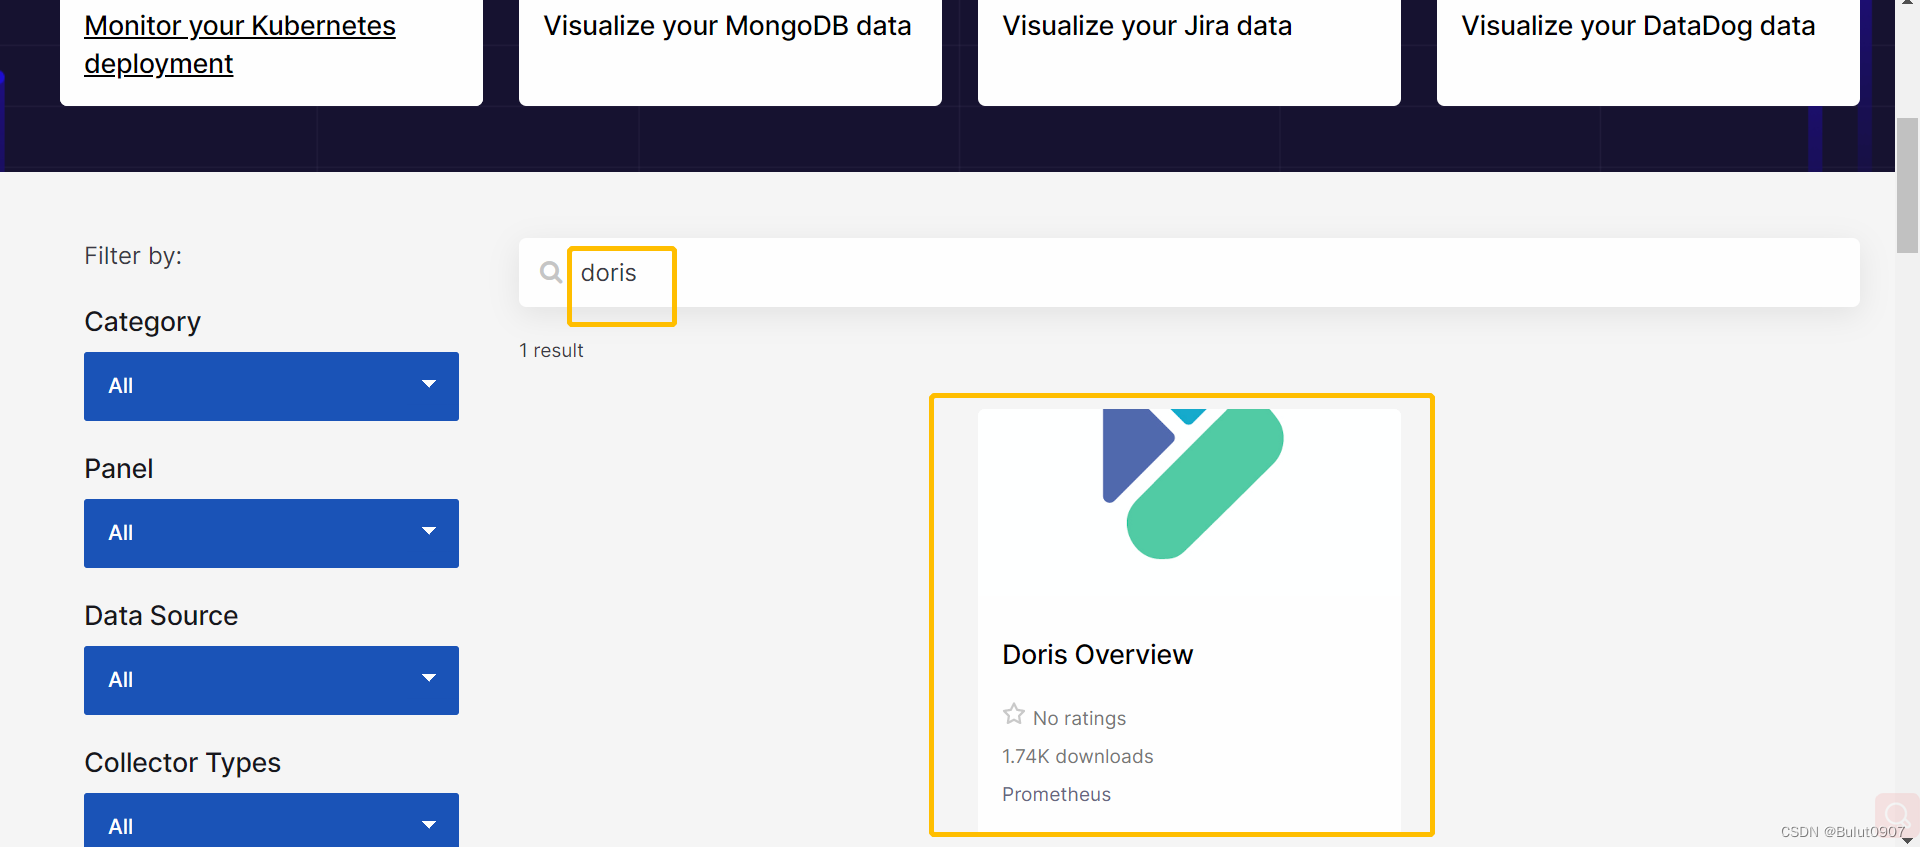
4. 下载Doris Dashboard模板
访问Grafana Dashboards下载网站,在下面搜索Doris,然后选择Dashboard进行json文件的下载