说明
【跟月影学可视化】学习笔记。
世界地图新冠肺炎疫情可视化
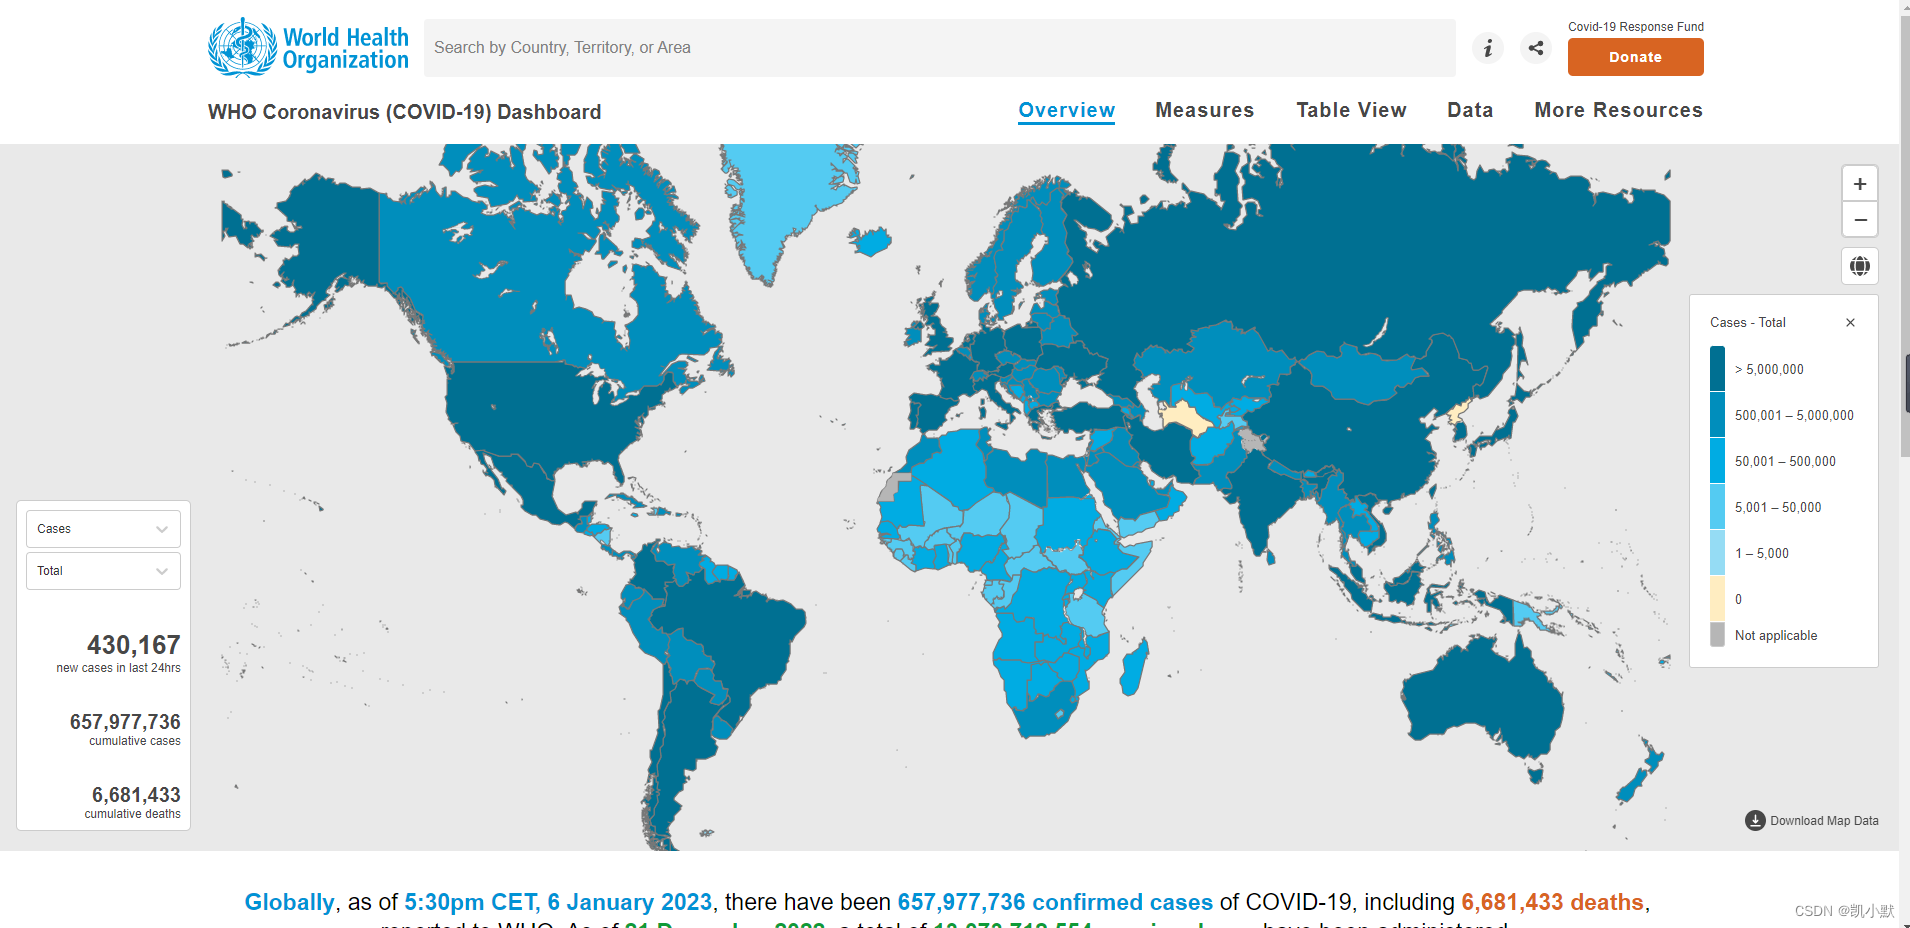
下面将实现世界地图新冠肺炎疫情可视化。数据用的是从 2020 年 1 月 22 日到 3 月 19 日这些天的新冠肺炎疫情进展。效果类似下图:https://covid19.who.int/
步骤一:准备世界地图可视化需要的数据
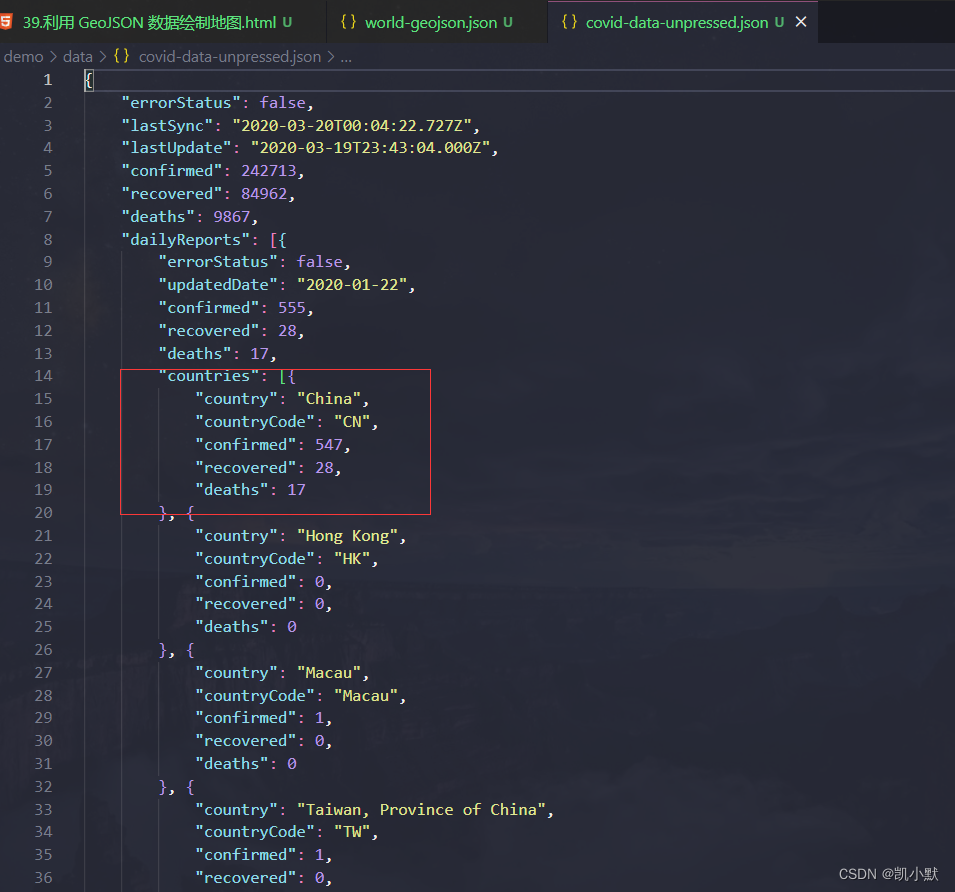
先需要准备新冠肺炎的官方数据( https://www.who.int/ )
这里直接使用大佬整理好的:https://github.com/akira-cn/graphics/blob/master/covid-vis/assets/data/covid-data.json
另外需要准备地图的 JSON 文件:
GeoJSON:基础格式,它包含了描述地图地理信息的坐标数据。TopoJSON:GeoJSON 格式经过压缩之后得到的,它通过对坐标建立索引来减少冗余,能够大大减少 JSON 文件的体积。但在使用的时候还需要对它解压,把它变成 GeoJSON 数据,可以使用https://github.com/topojson/topojson这个JavaScript 模块来处理 TopoJSON 数据。
什么是 geojson 数据可以去看我下面这篇文章,这里不多做介绍。
推荐阅读:
这里直接使用大佬整理好 geojson 以及 topojson 的 json 数据:
- https://github.com/akira-cn/graphics/blob/master/covid-vis/assets/data/world-geojson.json
- https://github.com/akira-cn/graphics/blob/master/covid-vis/assets/data/world-topojson.json
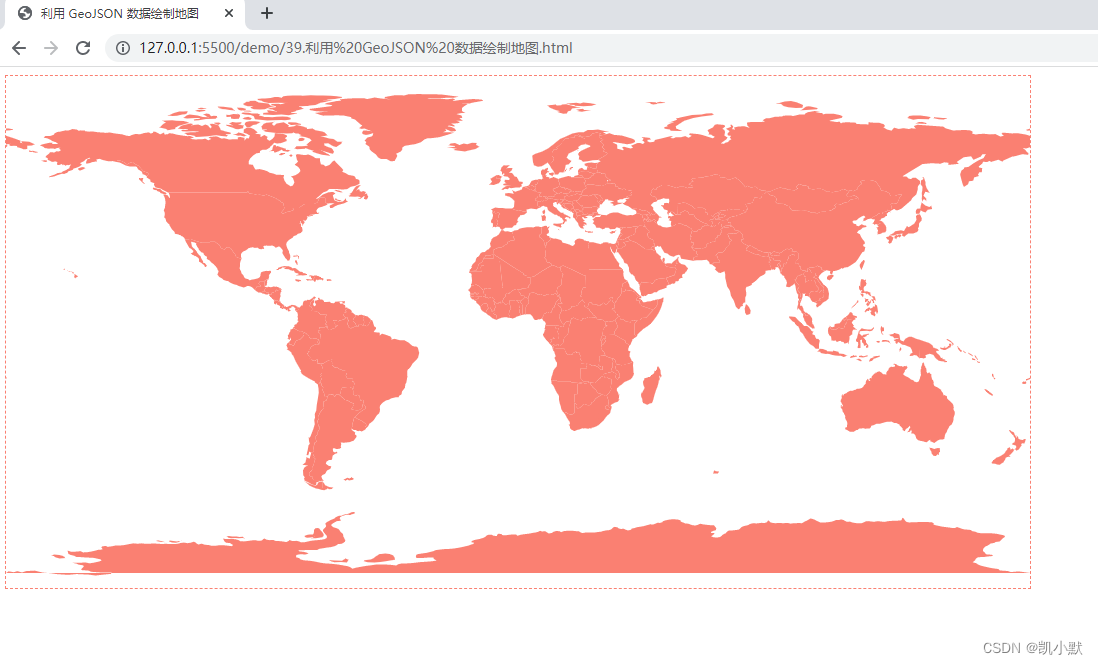
步骤二:利用 GeoJSON 数据绘制地图
下面使用 Canvas2D 来绘制地图,先了解一下墨卡托投影
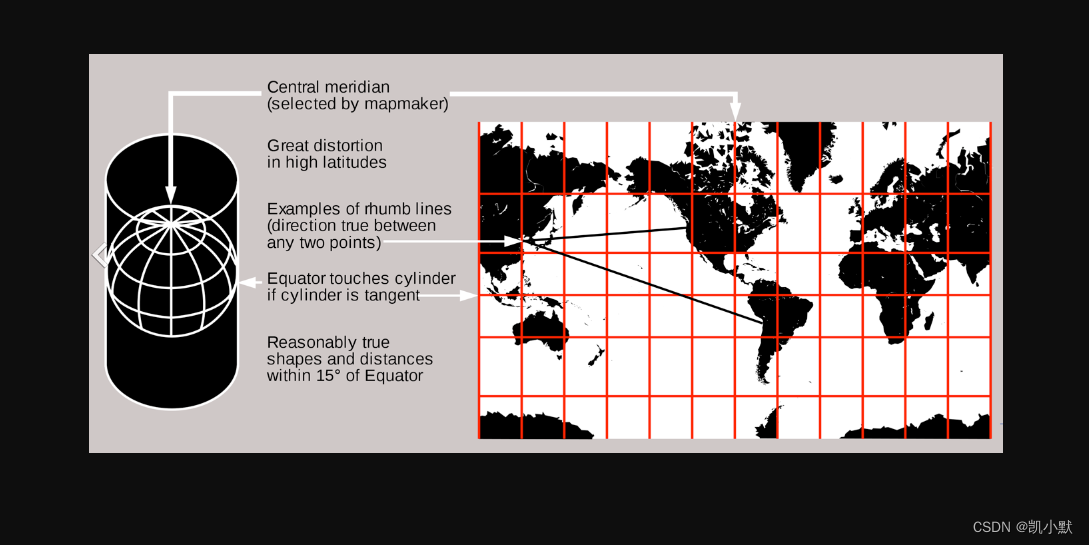
什么是墨卡托投影?
墨卡托投影,是正轴等角圆柱投影。由荷兰地图学家墨卡托(G.Mercator)于1569年创立。假想一个与地轴方向一致的圆柱切或割于地球,按等角条件,将经纬网投影到圆柱面上,将圆柱面展为平面后,即得本投影。
下面利用墨卡托投影将 GeoJSON 数据中,coordinates 属性里的经纬度信息转换成画布坐标。
经纬度投影示意图:
longitude:经度,经度范围是 360 度latitude:纬度,维度范围是 180 度width:Canvas 的宽度height:Canvas 的高度
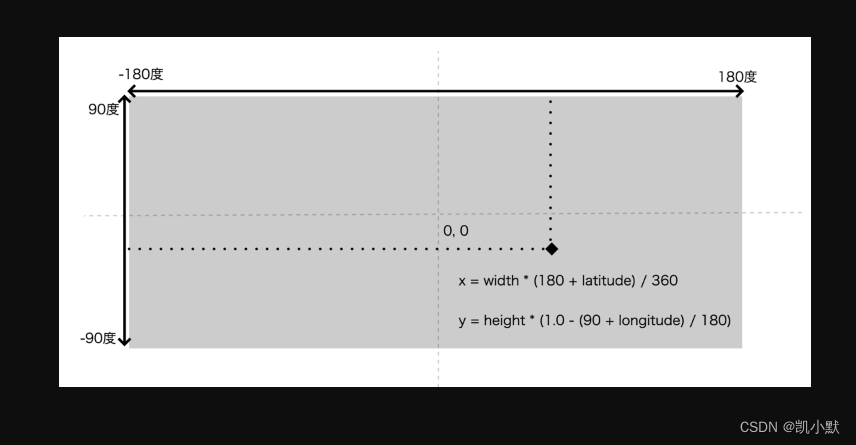
换算公式如下:
x = width * (180 + longitude) / 360;
y = height * (1.0 - (90 + latitude) / 180); // Canvas坐标系y轴朝下
具体实现如下:
<!DOCTYPE html>
<html lang="en">
    <head>
        <meta charset="UTF-8" />
        <meta http-equiv="X-UA-Compatible" content="IE=edge" />
        <meta name="viewport" content="width=device-width, initial-scale=1.0" />
        <title>利用 GeoJSON 数据绘制地图</title>
        <style>
            canvas {


                border: 1px dashed salmon;
            }
        </style>
    </head>
    <body>
        <canvas width="1024" height="512"></canvas>
        <script>
            const width = 1024;
            const height = 512;

            // 投影函数
            function projection([longitude, latitude]) {


                const x = (width * (180 + longitude)) / 360;
                const y = height * (1.0 - (90 + latitude) / 180); // Canvas坐标系y轴朝下
                return [x, y];
            }
            // 绘制
            function drawPoints(ctx, points) {


                ctx.beginPath();
                ctx.moveTo(...points[0]);
                for (let i = 1; i < points.length; i++) {


                    ctx.lineTo(...points[i]);
                }
                ctx.fill();
            }

            const canvas = document.querySelector("canvas");
            const ctx = canvas.getContext("2d");
            ctx.fillStyle = "salmon";

            (async function () {


                // 用 fetch 来读取 JSON 文件
                const worldData = await (await fetch("./data/world-geojson.json")).json();
                const features = worldData.features;
                // 遍历数据
                features.forEach(({

        geometry }) => {


                    if (geometry.type === "MultiPolygon") {


                        const coordinates = geometry.coordinates;
                        if (coordinates) {


                            coordinates.forEach((contours) => {


                                contours.forEach((path) => {


                                    // 进行投影转换
                                    const points = path.map(projection);
                                    // 进行绘制
                                    drawPoints(ctx, points);
                                });
                            });
                        }
                    } else if (geometry.type === "Polygon") {


                        const contours = geometry.coordinates;
                        contours.forEach((path) => {


                            // 进行投影转换
                            const points = path.map(projection);
                            // 进行绘制
                            drawPoints(ctx, points);
                        });
                    }
                });
            })();
        </script>
    </body>
</html>
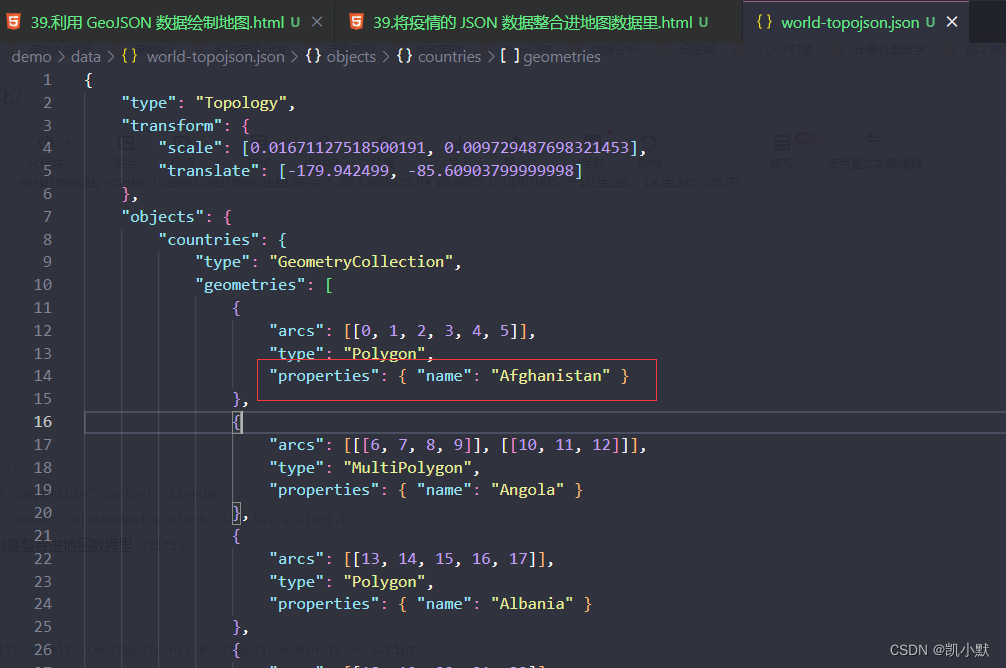
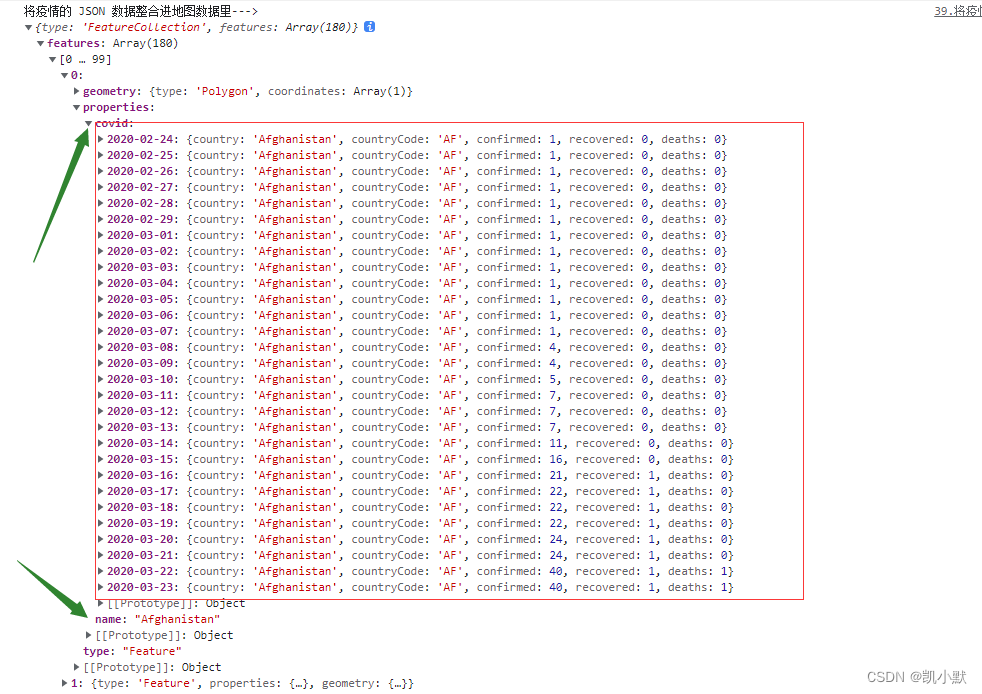
步骤三:将疫情的 JSON 数据整合进地图数据里
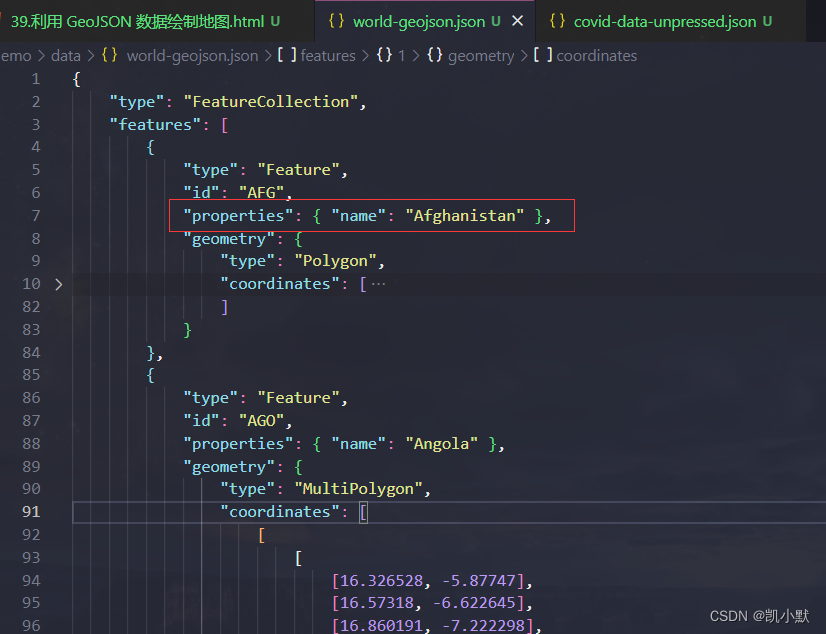
地图数据中,properties 只有一个 name 属性,对应着不同国家的名字。
疫情数据中的 contry 属性和 GeoJSON 数据里面的国家名称是一一对应的。
下面建立一个数据映射关系,将疫情数据中的每个国家的疫情数据直接写入到 GeoJSON 数据的 properties 字段里面。这里我们使用 topojson 处理。
<!DOCTYPE html>
<html lang="en">

<head>
	<meta charset="UTF-8" />
	<meta http-equiv="X-UA-Compatible" content="IE=edge" />
	<meta name="viewport" content="width=device-width, initial-scale=1.0" />
	<title>将疫情的 JSON 数据整合进地图数据里</title>
</head>

<body>
	<script src="https://lib.baomitu.com/topojson/3.0.2/topojson.min.js"></script>
	<script>
		// 数据映射函数
		function mapDataToCountries(geoData, covidData) {


			const covidDataMap = {

      };
			covidData.dailyReports.forEach((d) => {


				const date = d.updatedDate;
				const countries = d.countries;
				countries.forEach((country) => {


					const name = country.country;
					covidDataMap[name] = covidDataMap[name] || {

      };
					covidDataMap[name][date] = country;
				});
			});
			geoData.features.forEach((d) => {


				const name = d.properties.name;
				d.properties.covid = covidDataMap[name];
			});
		}

		(async function () {


			// 使用 topojson 数据
			const worldData = await (await fetch('./data/world-topojson.json')).json();
			const countries = topojson.feature(worldData, worldData.objects.countries);

			const covidData = await (await fetch('./data/covid-data.json')).json();
			mapDataToCountries(countries, covidData);

			console.log("将疫情的 JSON 数据整合进地图数据里--->", countries)
		})();
	</script>
</body>

</html>
整合数据如下:可以看到疫情数据已经整进去地图里面了
步骤四:将数据与地图结合
这里用7个不同的颜色来表示疫情的严重程度,填充地图,确诊人数越多的区域颜色越红。
<!DOCTYPE html>
<html lang="en">
    <head>
        <meta charset="UTF-8" />
        <meta http-equiv="X-UA-Compatible" content="IE=edge" />
        <meta name="viewport" content="width=device-width, initial-scale=1.0" />
        <title>世界地图新冠肺炎疫情可视化</title>
        <style>
            canvas {


                border: 1px dashed salmon;
            }
        </style>
    </head>
    <body>
        <div id="dateInfo"></div>
        <canvas width="1200" height="600"></canvas>
        <script src="https://lib.baomitu.com/topojson/3.0.2/topojson.min.js"></script>
        <script>
            const width = 1200;
            const height = 600;

            // 投影函数
            function projection([longitude, latitude]) {


                const x = (width * (180 + longitude)) / 360;
                const y = height * (1.0 - (90 + latitude) / 180); // Canvas坐标系y轴朝下
                return [x, y];
            }
            // 绘制
            function drawPoints(ctx, points) {


                ctx.beginPath();
                ctx.moveTo(...points[0]);
                for (let i = 1; i < points.length; i++) {


                    ctx.lineTo(...points[i]);
                }
                ctx.fill();
            }

            // 颜色映射
            function mapColor(confirmed) {


                // 无人感染
                if (!confirmed) {


                    return "rgb(80, 255, 80)";
                }
                // 小于 10
                if (confirmed < 10) {


                    return "rgb(250, 247, 171)";
                }
                // 感染人数 10~99 人
                if (confirmed < 100) {


                    return "rgb(255, 186, 66)";
                }
                // 感染人数 100~499 人
                if (confirmed < 500) {


                    return "rgb(234, 110, 41)";
                }
                // 感染人数 500~999 人
                if (confirmed < 1000) {


                    return "rgb(224, 81, 57)";
                }
                // 感人人数 1000~9999 人
                if (confirmed < 10000) {


                    return "rgb(192, 50, 39)";
                }
                // 感染人数超 10000 人
                return "rgb(151, 32, 19)";
            }

            // 日期格式
            function formatDate(date) {


                const year = date.getFullYear();
                let month = date.getMonth() + 1;
                month = month > 9 ? month : `0${
        month}`;
                let day = date.getDate();
                day = day > 9 ? day : `0${
        day}`;
                return `${
        year}-${
        month}-${
        day}`;
            }

            // 数据映射函数
            function mapDataToCountries(geoData, covidData) {


                const covidDataMap = {

      };
                covidData.dailyReports.forEach((d) => {


                    const date = d.updatedDate;
                    const countries = d.countries;
                    countries.forEach((country) => {


                        const name = country.country;
                        covidDataMap[name] = covidDataMap[name] || {

      };
                        covidDataMap[name][date] = country;
                    });
                });
                geoData.features.forEach((d) => {


                    const name = d.properties.name;
                    d.properties.covid = covidDataMap[name];
                });
            }

            // 绘制地图
            function drawMap(ctx, countries, date) {


                date = formatDate(date);
                dateInfo.innerHTML = date;
                countries.features.forEach(({

        geometry, properties }) => {


                    const covid = properties.covid
                        ? properties.covid[date]
                        : null;
                    let confirmed;
                    if (covid) {


                        confirmed = covid.confirmed;
                        properties.lastConfirmed = confirmed;
                    } else if (properties.lastConfirmed) {


                        confirmed = properties.lastConfirmed;
                    }
                    ctx.fillStyle = mapColor(confirmed);
                    if (geometry.type === "MultiPolygon") {


                        const coordinates = geometry.coordinates;
                        if (coordinates) {


                            coordinates.forEach((contours) => {


                                contours.forEach((path) => {


                                    const points = path.map(projection);
                                    drawPoints(ctx, points);
                                });
                            });
                        }
                    } else if (geometry.type === "Polygon") {


                        const contours = geometry.coordinates;
                        contours.forEach((path) => {


                            const points = path.map(projection);
                            drawPoints(ctx, points);
                        });
                    }
                });
            }

            const canvas = document.querySelector("canvas");
            const ctx = canvas.getContext("2d");

            (async function () {


                // 使用 topojson 数据
                const worldData = await (
                    await fetch("./data/world-topojson.json")
                ).json();
                const countries = topojson.feature(
                    worldData,
                    worldData.objects.countries
                );
                // 疫情数据
                const covidData = await (
                    await fetch("./data/covid-data.json")
                ).json();
                mapDataToCountries(countries, covidData);

                // 开始日期
                const startDate = new Date("2020/01/22");
                let i = 0;
                // 自动绘制
                const timer = setInterval(() => {


                    const date = new Date(startDate.getTime() + 86400000 * ++i);
                    drawMap(ctx, countries, date);
                    if (date.getTime() + 86400000 > Date.now()) {


                        clearInterval(timer);
                    }
                }, 100);
                drawMap(ctx, countries, startDate);
            })();
        </script>
    </body>
</html>
效果实现如下: