学习资料参考:
张平.《OpenCV算法精解:基于Python与C++》.[Z].北京.电子工业出版社.2017.
前言
直方图,熟悉的概念,可以用来表示每个数出现的概率,即频次。那么运用在图像处理中,简单的来说,如灰度图,就是表示灰度图中每个像素值的个数。
原理详解
而表示像素的用处在于对一些背景与前景在图中黑白上右明显的对比界限。如下图所示:
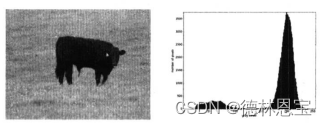
上图中前景中的牛的灰度值大一些,而草地的灰度值小一些,两者的灰度值存在明显的差异。
上图右侧的直方图则展示了该图片灰度值的统计图,这些灰度值的在中间明显有分界值,即阈值。直方图就可用于寻找该阈值,即两个波峰之间的波谷位置对应的灰度值,就是该阈值,然后将前景与背景分离开来。
存在的问题
但是灰度值不能够保证只有一个波谷,两个波峰,存在随机波动,如两个峰值之间存在两个最小值,那么如何判断是需要解决的方法。
常用的解决方法:
- 手动调节:对直方图进行高斯平滑处理,逐渐增大高斯滤波器的标准差,直到只有一个波谷和两个波峰为止。
- 自动选取:
- 找到灰度直方图的第一个峰值,并找到其对应的灰度值,用top1表示。
- 找到直方图的第二个峰值,并找到其灰度值。注意该峰值只需要找到距离第一个峰值的附近的峰值,
- 找到这两个峰值之间的波谷,如果出现两个或者多个波谷,则取左侧的波谷即可,其对应的灰度值即为阈值。
Python实现
- 寻找最大值解决方案
# 寻找最大值的方法
hist = np.array([10, 3, 13, 2, 1, 5])
maxLoc = np.where(hist==np.max(hist))
print(maxLoc)

# 出现多个最大值的寻找方法

hist = np.array([10, 3, 13, 2, 13, 5])
maxLoc = np.where(hist==np.max(hist))
print(maxLoc)
运行结果
(array([2]),)
(array([2, 4]),)
- 用于图片的处理实现
import cv2
import numpy as np

image = cv2.imread(r"C:\Users\1\Pictures\test.jpg", 0)
h,w = image.shape[:2]
gray_hist = np.zeros([256], np.uint64)
for i in range(h):
    for j in range(w):
        gray_hist[image[i][j]] += 1
hist = gray_hist
# 第一个峰值
maxLoc = np.where(hist == np.max(hist))
firstPeak = maxLoc[0][0]
# 第二个峰值
measureDists = np.zeros([256], np.float32)
for k in range(256):
    measureDists[k] = pow(k - firstPeak, 2) * hist[k]
maxLoc2 = np.where(measureDists == np.max(measureDists))
secondPeak = maxLoc2[0][0]
# 两个峰值之间的最小值对应的灰度值,作为阈值
thresh = 0
if firstPeak > secondPeak:
    temp = hist[int(secondPeak):int(firstPeak)]
    minLoc = np.where(temp == np.min(temp))
    thresh = secondPeak + minLoc[0][0] + 1
else:
    temp = hist[int(firstPeak):int(secondPeak)]
    minLoc = np.where(temp == np.min(temp))
    thresh = firstPeak + minLoc[0][0] + 1
threshImage = image.copy()
threshImage[threshImage > thresh] = 255
threshImage[threshImage <= thresh] = 0
cv2.imshow("test", threshImage)
cv2.waitKey(0)
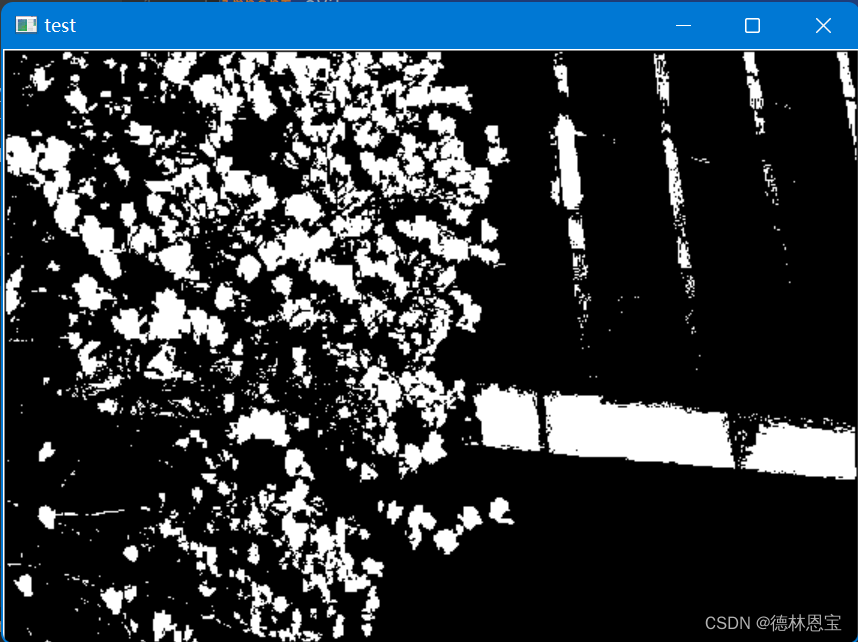
测试结果
原图

二值化后图像