import cv2 as cv
import numpy as np
import matplotlib.pyplot as plt
img = cv.imread("../SampleImages/pomeranian.png", cv.IMREAD_COLOR)
print(img.shape)
#图像直方图计算
#cv.calcHist(images, channels, mask, histSize, ranges, hist, accumulate)
#images:原图像(图像格式为 uint8 或 float32)。当传入函数时应该 用中括号 [] 括起来,例如:[img]。
#channels:同样需要用中括号括起来,它会告诉函数我们要统计那幅图 像的直方图。如果输入图像是灰度图,它的值就是 [0];如果是彩色图像 的话,传入的参数可以是 [0],[1],[2] 它们分别对应着通道 B,G,R。
#mask: 掩模图像。要统计整幅图像的直方图就把它设为 None。但是如 果你想统计图像某一部分的直方图的话,你就需要制作一个掩模图像,并 使用它。
#histSize:BIN 的数目。也应该用中括号括起来,例如:[256]。
#ranges: 像素值范围,通常为 [0,256]
#hist:是一个 256x1 的数组作为返回值,每一个值代表了与次灰度值对应的像素点数目。
#accumulate:是一个布尔值,用来表示直方图是否叠加。
#参考资料:https://blog.csdn.net/yukinoai/article/details/87900860
#1. mask为None,对整幅图计算直方图
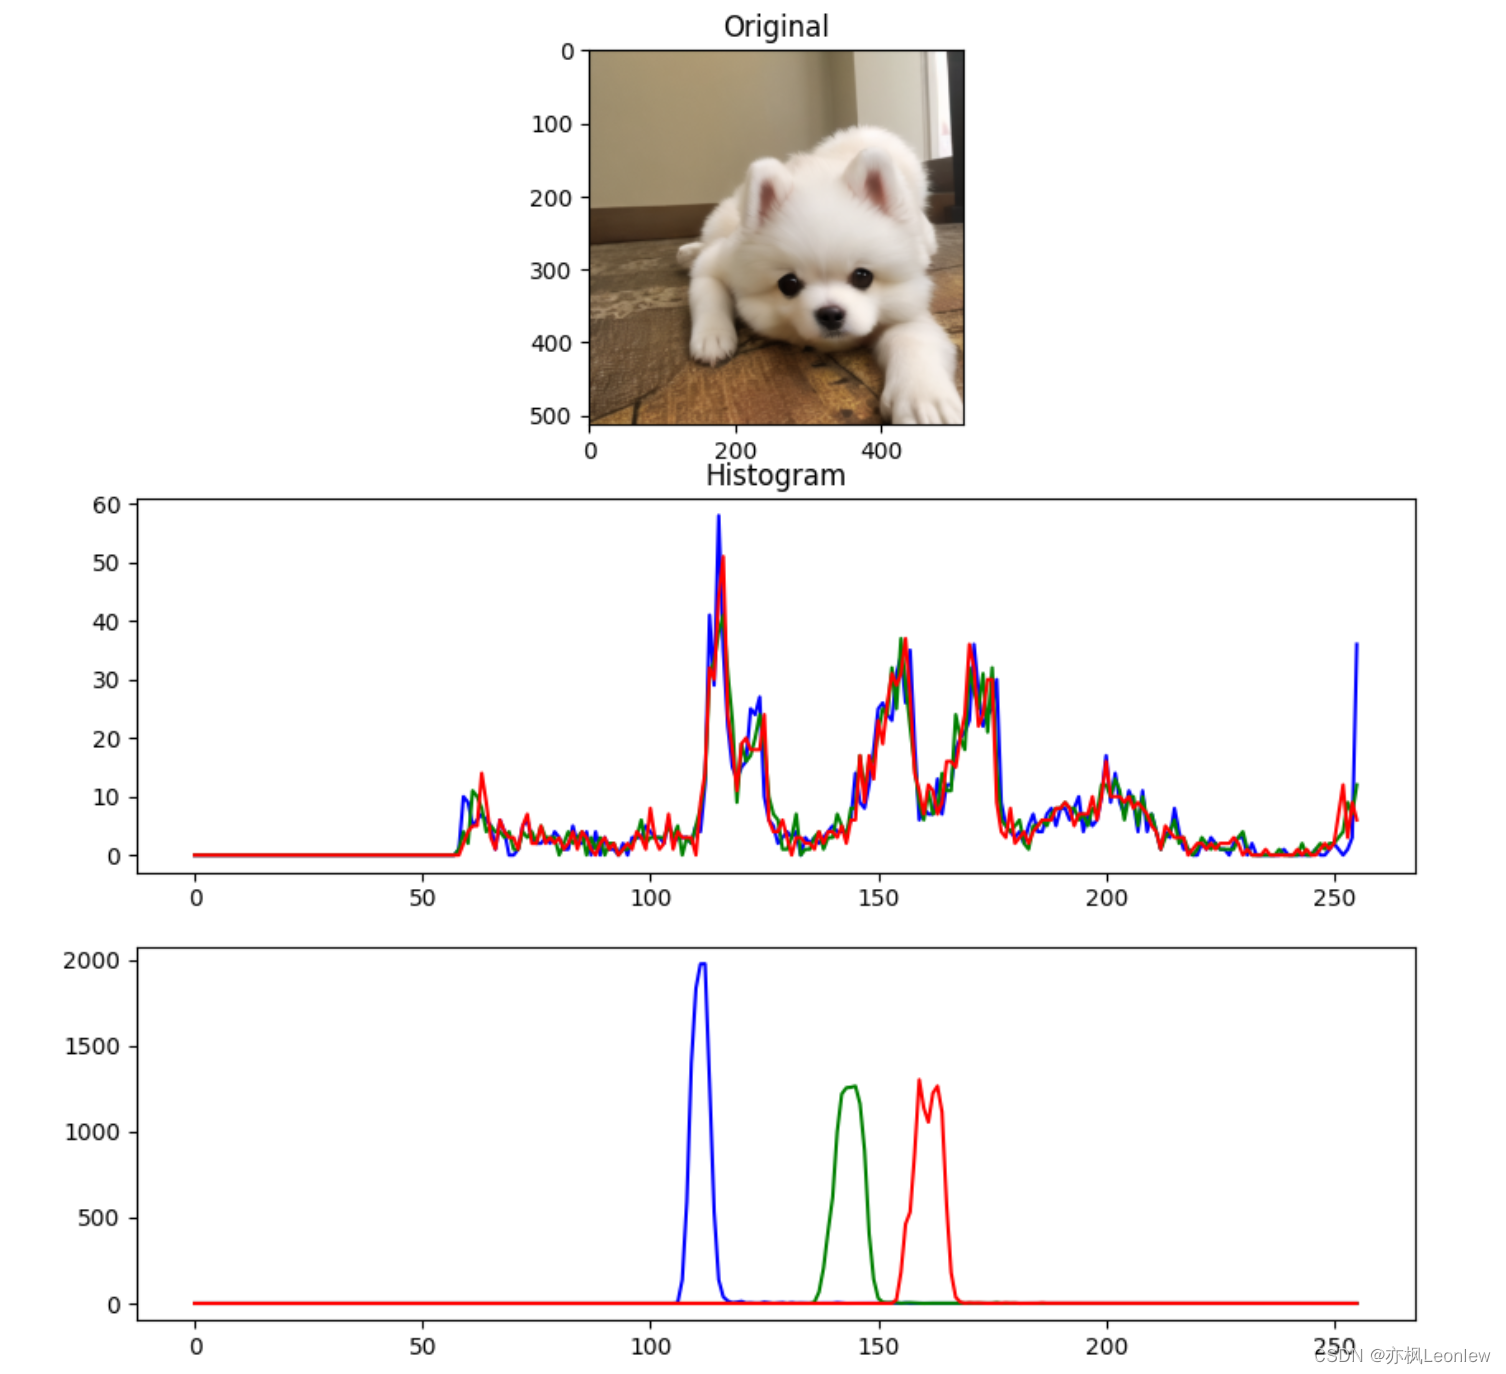
hist_b = cv.calcHist(img, [0], None, [256], [0,256])
hist_g = cv.calcHist(img, [1], None, [256], [0,256])
hist_r = cv.calcHist(img, [2], None, [256], [0,256])
#2. 使用mask计算局部图像直方图
# mask的使用:https://www.coder.work/article/2087445
mask = np.zeros(img.shape[:2], np.uint8)
mask[100:200,100:200]=255
hist_mask_b = cv.calcHist([img], [0], mask, [256], [0,256])
hist_mask_g = cv.calcHist([img], [1], mask, [256], [0,256])
hist_mask_r = cv.calcHist([img], [2], mask, [256], [0,256])
#显示图像
fig,axes = plt.subplots(nrows=3, ncols=1, figsize=(10,10), dpi=100)
axes[0].imshow(img[:,:,::-1])
axes[0].set_title("Original")
axes[1].set_title("Histogram")
axes[1].plot(hist_b, color='b')
axes[1].plot(hist_g, color='g')
axes[1].plot(hist_r, color='r')
axes[2].plot(hist_mask_b, color='b')
axes[2].plot(hist_mask_g, color='g')
axes[2].plot(hist_mask_r, color='r')