版权声明:转载请说明来源,谢谢 https://blog.csdn.net/wsp_1138886114/article/details/82938892
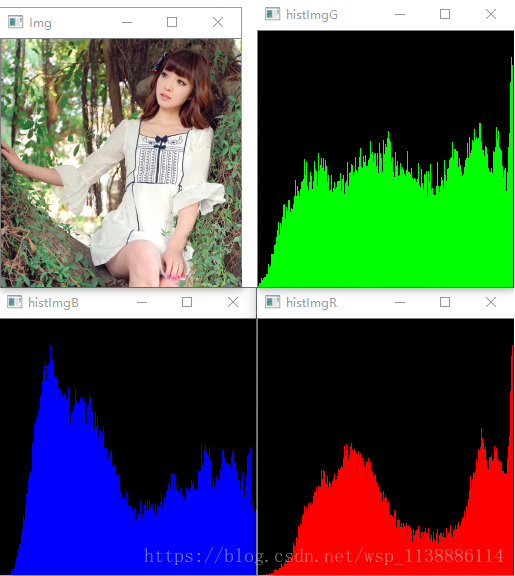
一、读取图片并展示:颜色直方图
OpenCV-Python中调用的直方图计算函数为cv2.calcHist。
"""
hist = cv2.calcHist([image],             # 传入图像(列表)
                    [0],                 # 使用的通道(使用通道:可选[0],[1],[2])
                    None,                # 没有使用mask(蒙版)
                    [256],               # HistSize
                    [0.0,255.0])         # 直方图柱的范围
                                         # return->list
"""

import cv2
import numpy as np
import matplotlib.pyplot as plt

def calcAndDrawHist(image, color):
    hist= cv2.calcHist([image], [0], None, [256], [0.0,255.0])
    minVal, maxVal, minLoc, maxLoc = cv2.minMaxLoc(hist)
    histImg = np.zeros([256,256,3], np.uint8)
    hpt = int(0.9* 256);

    for h in range(256):
        intensity = int(hist[h]*hpt/maxVal)
        cv2.line(histImg,(h,256), (h,256-intensity), color)
    return histImg


if __name__ == '__main__':
    original_img = cv2.imread("666.png")
    img = cv2.resize(original_img,None,fx=0.6,fy=0.6,interpolation = cv2.INTER_CUBIC)
    b, g, r = cv2.split(img)

    histImgB = calcAndDrawHist(b, [255, 0, 0])
    histImgG = calcAndDrawHist(g, [0, 255, 0])
    histImgR = calcAndDrawHist(r, [0, 0, 255])

    cv2.imshow("histImgB", histImgB)
    cv2.imshow("histImgG", histImgG)
    cv2.imshow("histImgR", histImgR)
    cv2.imshow("Img", img)
    cv2.waitKey(0)
    cv2.destroyAllWindows()
二、直方图均衡化
为什么要进行直方图均衡化呢?我们日常拍照时,背对太阳时或晚上出现图像欠曝,面对太阳拍照会出现过曝,图像均衡可以通过图像直方图均衡来调整图像,也可以通过 校正,来校正图片。
2.1 使用查找表来拉伸直方图
在图像处理中,直方图均衡化一般用来均衡图像的强度,或增加图像的对比度。
观察上图中原始图像的直方图,很容易发现大部分强度值范围都没有用到。
因此先检测图像非0的最低(imin)强度值和最高(imax)强度值。
将最低值imin设为0,最高值imax设为255。中间的按255.0*(i-imin)/(imax-imin)+0.5)的形式设置。
import cv2
import numpy as np

image = cv2.imread("ABC.png", 0)
lut = np.zeros(256, dtype = image.dtype )  # 创建空的查找表
hist= cv2.calcHist([image],                # 计算图像的直方图
                   [0],                    # 使用的通道
                   None,                   # 没有使用mask
                   [256],                  # it is a 1D histogram
                   [0.0,255.0])
minBinNo, maxBinNo = 0, 255

for binNo, binValue in enumerate(hist):         #计算从左起第一个不为0的直方图柱的位置
    if binValue != 0:
        minBinNo = binNo
        break

for binNo, binValue in enumerate(reversed(hist)):#计算从右起第一个不为0的直方图柱的位置
    if binValue != 0:
        maxBinNo = 255-binNo
        break
print(minBinNo, maxBinNo)

for i,v in enumerate(lut):                      #生成查找表,方法来自参考文献1第四章第2节
    print(i)
    if i < minBinNo:
        lut[i] = 0
    elif i > maxBinNo:
        lut[i] = 255
    else:
        lut[i] = int(255.0*(i-minBinNo)/(maxBinNo-minBinNo)+0.5)

#计算
result = cv2.LUT(image, lut)
cv2.imshow("hist", hist)
cv2.imshow("Result", result)
cv2.waitKey(0)
cv2.destroyAllWindows()
直方图均衡化
import cv2

img = cv2.imread("ABC.png",0)
equ = cv2.equalizeHist(img)
cv2.imshow('equ',equ)
cv2.waitKey(0)
cv2.destroyAllWindows()

import cv2
import numpy as np

image = cv2.imread("ABC.png", 0)
lut = np.zeros(256, dtype = image.dtype )                  #创建空的查找表

hist,bins = np.histogram(image.flatten(),256,[0,256])
cdf = hist.cumsum()                                        #计算累积直方图
cdf_m = np.ma.masked_equal(cdf,0)                          #除去直方图中的0值
cdf_m = (cdf_m - cdf_m.min())*255/(cdf_m.max()-cdf_m.min())#等同于前面介绍的lut[i] = int(255.0 *p[i])公式
cdf = np.ma.filled(cdf_m,0).astype('uint8')                #将掩模处理掉的元素补为0

#计算
result2 = cdf[image]
result = cv2.LUT(image, cdf)

cv2.imshow("OpenCVLUT", result)
cv2.imshow("NumPyLUT", result2)
cv2.waitKey(0)
cv2.destroyAllWindows()