plt.imshow()作用就是展示一副热度图,将数组表示为一幅图
import numpy as np
import matplotlib.pyplot as plt
x=np.array([[10,20,30,40],
[50,60,70,80]])
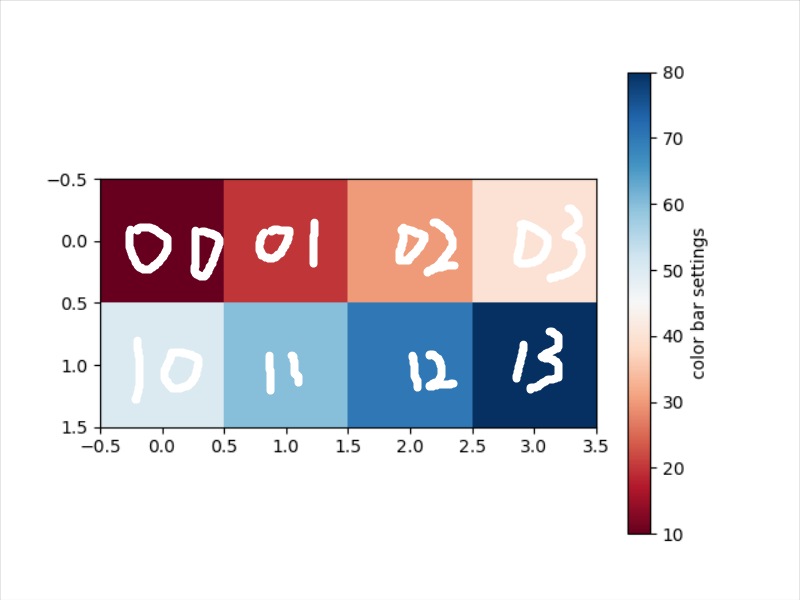
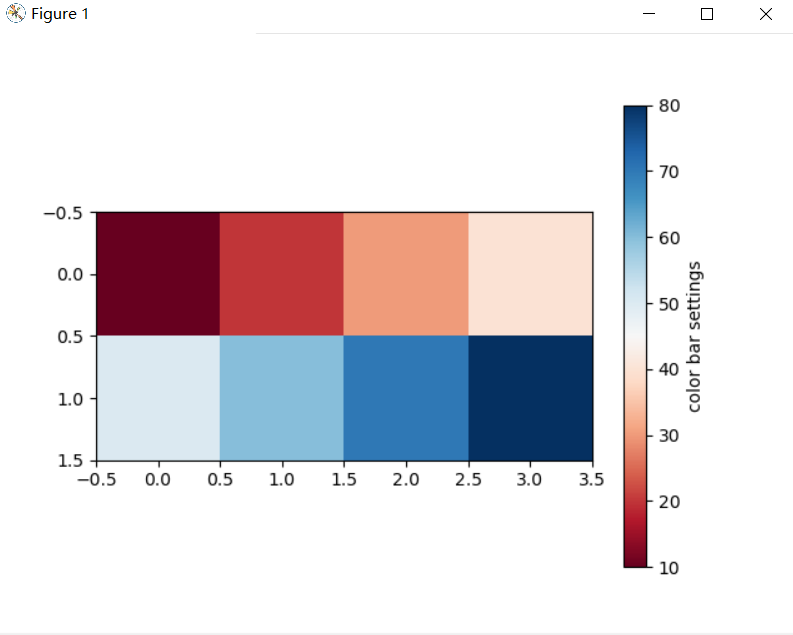
plt.imshow(x, cmap='RdBu')
cb = plt.colorbar(label='color bar settings')
plt.show()看下图,横纵坐标表示的数组的索引。
比如:30是x的第0行第2列,那么它是02那个位置,color bar settings可找到数值为30的颜色,与图中相对应