【OpenCV 例程200篇】04. 用 matplotlib 显示图像(plt.imshow)
欢迎关注 『youcans 的 OpenCV 例程 200 篇』 系列,持续更新中
更多内容,请见:
【OpenCV 例程200篇 总目录-202206更新】(https://blog.csdn.net/youcans/article/details/124565960)
函数 plt.imshow() 用于通过 matplotlib 库显示图像。
函数说明:
matplotlib.pyplot.imshow(img[, cmap])
OpenCV 使用 BGR 格式,matplotlib/PyQt 使用 RGB 格式。使用 matplotlib/PyQt 显示 openCV 图像,要将 BGR 格式转换为 RGB 格式:
# 图片格式转换:BGR(OpenCV) -> RGB(PyQt5)
imgRGB = cv2.cvtColor(imgBGR, cv2.COLOR_BGR2RGB)
参数说明:
- img:图像数据,nparray 多维数组,对于 openCV(BGR)格式图像要先进行格式转换
- cmap:颜色图谱(colormap),默认为 RGB(A) 颜色空间
- gray:灰度显示
- hsv:hsv 颜色空间
注意事项:
- OpenCV 和 matplotlib 中的彩色图像都是 Numpy 多维数组。但 OpenCV 使用 BGR 格式,颜色分量按照蓝/绿/红的次序排列,而 matplotlib 使用 RGB 格式,颜色分量按照红/绿/蓝的次序排序。因此用 plt.imshow() 显示 OpenCV 彩色图像时,先要进行颜色空间转换,将Numpy 多维数组按照红/绿/蓝的次序排序。
- plt.imshow() 可以直接显示 OpenCV 灰度图像,不需要格式转换,但需要使用 cmap=‘gray’ 进行参数设置。
- plt.imshow() 可以使用 matplotlib 库中的各种方法绘图,如标题、坐标轴、插值等,详见 matploblib Document。
- PyQt5 也使用 RGB 格式,因此在 PyQt5 中显示 OpenCV 彩色图像时,也要进行颜色空间转换。
基本例程:
    # 1.10 图像显示(plt.imshow)
    imgFile = "../images/imgLena.tif"  # 读取文件的路径
    img1 = cv2.imread(imgFile, flags=1)  # flags=1 读取彩色图像(BGR)

    imgRGB = cv2.cvtColor(img1, cv2.COLOR_BGR2RGB)  # 图片格式转换:BGR(OpenCV) -> RGB(PyQt5)
    img2 = cv2.cvtColor(img1, cv2.COLOR_BGR2GRAY)  # 图片格式转换:BGR(OpenCV) -> Gray

    plt.rcParams['font.sans-serif'] = ['FangSong']  # 支持中文标签
    plt.subplot(221), plt.title("1. RGB 格式(mpl)"), plt.axis('off')
    plt.imshow(imgRGB)  # matplotlib 显示彩色图像(RGB格式)
    plt.subplot(222), plt.title("2. BGR 格式(OpenCV)"), plt.axis('off')
    plt.imshow(img1)    # matplotlib 显示彩色图像(BGR格式)
    plt.subplot(223), plt.title("3. 设置 Gray 参数"), plt.axis('off')
    plt.imshow(img2, cmap='gray')  # matplotlib 显示灰度图像,设置 Gray 参数
    plt.subplot(224), plt.title("4. 未设置 Gray 参数"), plt.axis('off')
    plt.imshow(img2)  # matplotlib 显示灰度图像,未设置 Gray 参数
    plt.show()
程序说明:
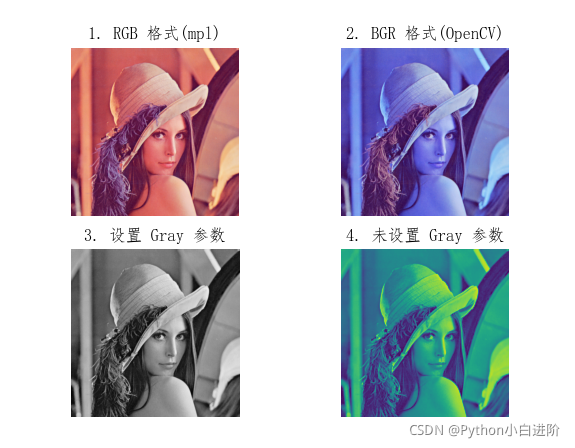
图 1 中 OpenCV 的 BGR 彩色图像已转换为 RGB 格式,彩色图像的颜色显示正常;
图 2 中 OpenCV 的 BGR 彩色图像格式未做转换,彩色图像的颜色显示异常;
图 3 中 plt.imshow() 设置 cmap=‘gray’,灰度图像的颜色显示正常;
图 4 中 plt.imshow() 未设置 cmap=‘gray’,灰度图像的颜色显示异常。
(本节完)
版权声明:
youcans@xupt 原创作品,转载必须标注原文链接:(https://blog.csdn.net/youcans/article/details/121169102)
Copyright 2022 youcans, XUPT
Crated:2021-11-18
欢迎关注 『youcans 的 OpenCV 例程 200 篇』 系列,持续更新中
更多内容,请见:
【OpenCV 例程200篇 总目录-202206更新】(https://blog.csdn.net/youcans/article/details/124565960)
【youcans 的 OpenCV 例程200篇】01. 图像的读取(cv2.imread)
【youcans 的 OpenCV 例程200篇】02. 图像的保存(cv2.imwrite)
【youcans 的 OpenCV 例程200篇】03. 图像的显示(cv2.imshow)
【youcans 的 OpenCV 例程200篇】04. 用 matplotlib 显示图像(plt.imshow)
【youcans 的 OpenCV 例程200篇】05. 图像的属性(np.shape)