前言
研究RocketMQ的同学都知道,RocketMQ的生态目前并不是很完善,包括官方的文档资料也有限,官方的Console存在一些Bug,页面的样式有的也有问题,但是正是由于这些原因,我们针对RocketMQ能做的事有很多,不像Kafka,生态已经很完善,一些企业也对Kafka做了开源的产品,最近开始做基于K8S的RocketMQ管理控制台,需要对每个集群有完善的监控告警,接下来就简单说明一下做RocketMQ的监控有哪些步骤。
部署rocketmq-exporter
以下操作基于Linux系统。
首先需要下载官方rocketmq-exporter的源码,需要修改几个配置
GitHub地址:https://github.com/apache/rocketmq-exporter.git
1、修改application.yml配置文件
需要修改nameserver地址,端口号根据自己的情况修改

2、修改日志路径:

3、修改pom文件中rocketmq的版本:
4、如果maven打包报错,注释这部分内容:

执行完以上的修改之后,打jar包,上传到服务器,启动即可,启动脚本可以参考如下,涉及的路径换成自己的即可:
#!/bin/bash

PID=`ps -ef | grep '/neworiental/rocketmq/rocketmq-exporter' | grep -v grep | awk '{print $2}'`
if [[ "" !=  "$PID" ]]; then
  echo "killing rocketmq-exporter : $PID"
  kill $PID
fi

sleep 1

LOGS_DIR=/neworiental/rocketmq/rocketmq-exporter/logs

MAIN_JAR="-jar /neworiental/rocketmq/rocketmq-exporter/rocketmq-exporter-0.0.2-SNAPSHOT.jar  "
JAVA_ARGS="-server -Xms4096m -Xmx4096m -XX:+UseG1GC -XX:+PrintGCDetails -XX:+PrintHeapAtGC  -XX:ThreadStackSize=512 -Xloggc:${LOGS_DIR}/gc.log "

if [ ! -d ${LOGS_DIR} ]
then
    mkdir -p ${LOGS_DIR}
fi
echo ${JAVA_ARGS} ${MAIN_JAR} ${CLASSPATH}
nohup java ${JAVA_ARGS} ${MAIN_JAR} >/dev/null 2>&1 &
echo "deploying rocketmq-exporter-0.0.2-SNAPSHOT.jar now ..."
安装Prometheus
1、下载二进制包:https://prometheus.io/download/#prometheus
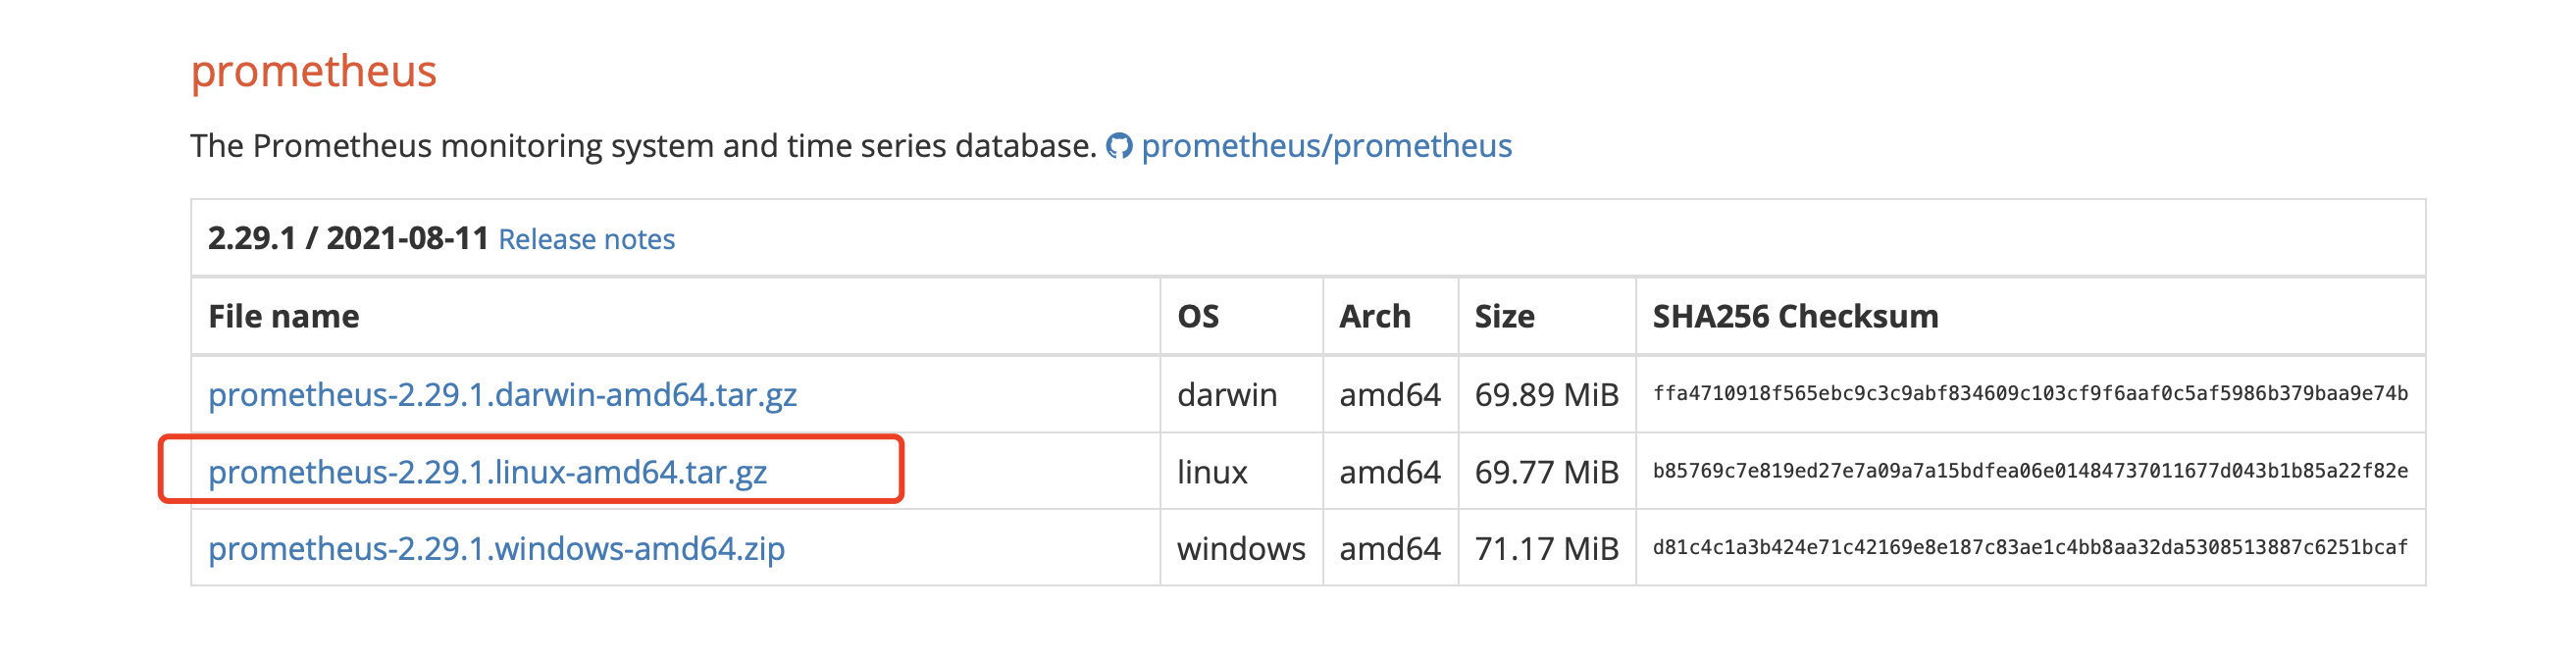
上传二进制包到服务器,我下载下来是.tar结尾的,直接tar -xvf prometheus-2.29.1.linux-amd64.tar
[root@iZ2ze434lxf5ptmro9mmprZ prometheus-2.29.1]# ll
total 188716
drwxr-xr-x 2 3434 3434        38 Aug 11 22:56 console_libraries
drwxr-xr-x 2 3434 3434       173 Aug 11 22:56 consoles
drwxr-xr-x 9 root root       240 Aug 17 19:00 data
-rw-r--r-- 1 3434 3434     11357 Aug 11 22:56 LICENSE
-rw-r--r-- 1 3434 3434      3646 Aug 11 22:56 NOTICE
-rwxr-xr-x 1 3434 3434 102094829 Aug 11 22:51 prometheus
-rw------- 1 root root       942 Aug 17 15:46 prometheus.yml
-rwxr-xr-x 1 3434 3434  91126074 Aug 11 22:53 promtool
修改prometheus.yml配置文件,添加rocketmq-exporter的监听配置

将targets中的ip端口改成自己的rocketmq-exporter的即可。
[root@iZ2ze434lxf5ptmro9mmprZ prometheus-2.29.1]# cat prometheus.yml
# my global config
global:
  scrape_interval: 15s # Set the scrape interval to every 15 seconds. Default is every 1 minute.
  evaluation_interval: 15s # Evaluate rules every 15 seconds. The default is every 1 minute.
  # scrape_timeout is set to the global default (10s).

# Alertmanager configuration
alerting:
  alertmanagers:
    - static_configs:
        - targets:
          # - alertmanager:9093

# Load rules once and periodically evaluate them according to the global 'evaluation_interval'.
rule_files:
  # - "first_rules.yml"
  # - "second_rules.yml"

# A scrape configuration containing exactly one endpoint to scrape:
# Here it's Prometheus itself.
scrape_configs:
  # The job name is added as a label `job=<job_name>` to any timeseries scraped from this config.
  - job_name: "prometheus"
    static_configs:
      - targets: ["localhost:9090"]

  - job_name: "RocketMQ"
    static_configs:
      - targets: ["ip:端口"]
[root@iZ2ze434lxf5ptmro9mmprZ prometheus-2.29.1]#
进入bin目录下,启动Prometheus:
./prometheus --config.file=./prometheus.yml &
检验是否启动成功,使用prometheus所在机器ip加上9090端口号访问:
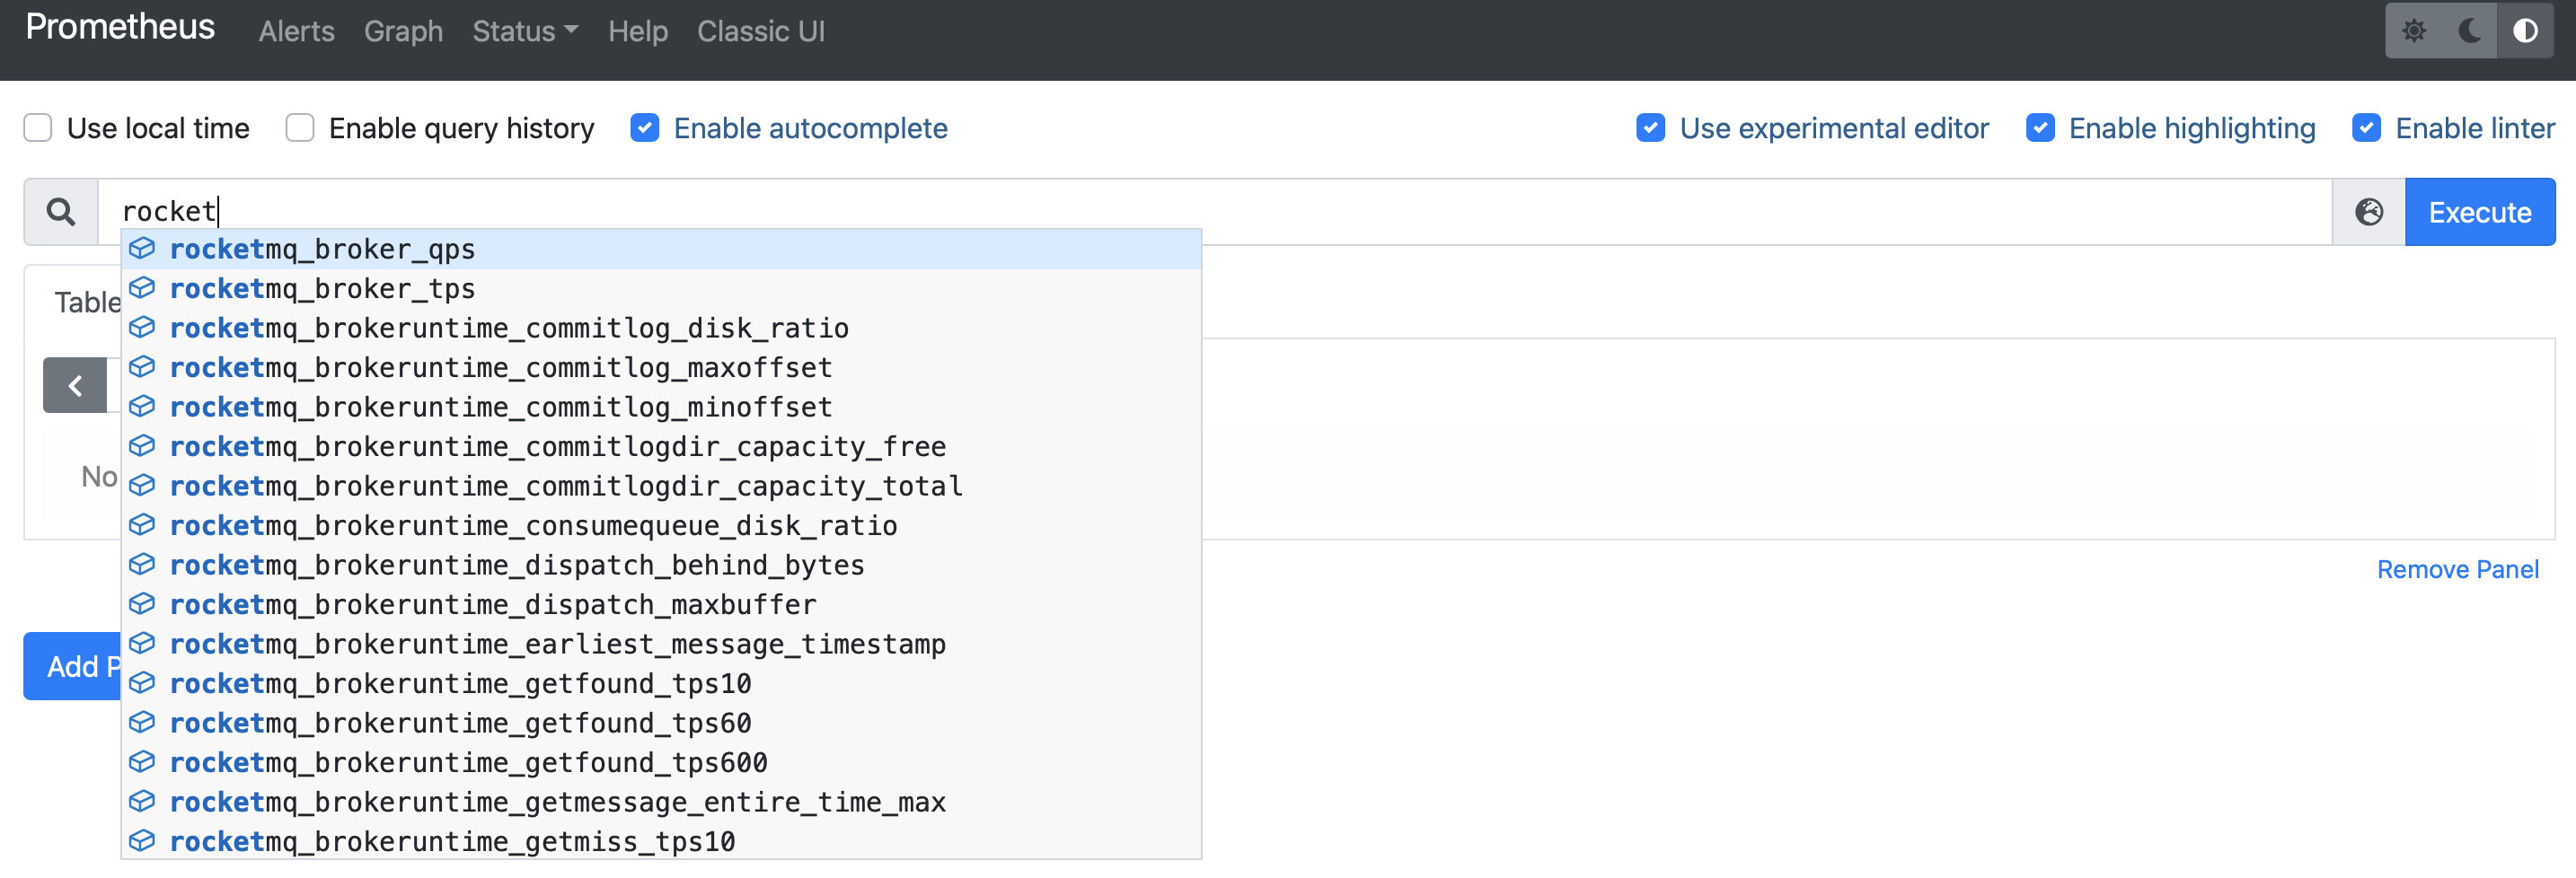
可以看到Prometheus已经启动成功,并且rocketmq-exporter采集的指标也收集到了。
安装Grafana
1、使用yum安装:yum -y install grafana-8.1.1
安装完之后,配置文件在/etc/grafana下
[root@iZ2ze434lxf5ptmro9mmprZ neworiental]#
[root@iZ2ze434lxf5ptmro9mmprZ neworiental]# whereis grafana
grafana: /etc/grafana /usr/share/grafana
[root@iZ2ze434lxf5ptmro9mmprZ neworiental]#
[root@iZ2ze434lxf5ptmro9mmprZ neworiental]#
2、启动Grafana:systemctl start grafana-server.service,启动后使用3000端口访问:
默认用户名密码都是admin,第一次登陆会提示修改

配置Grafana数据源
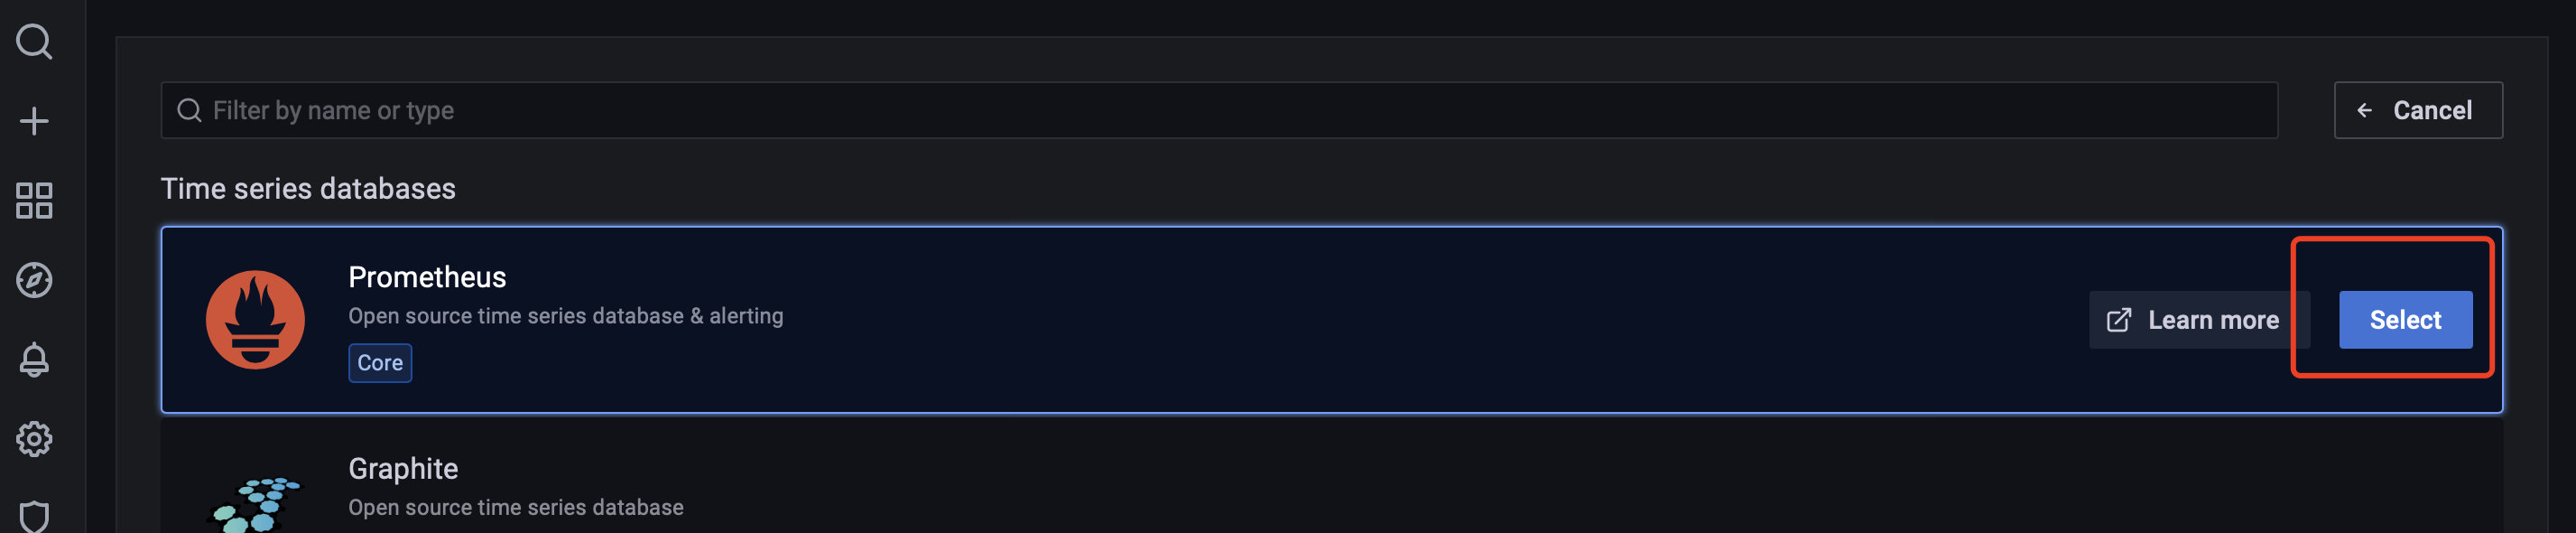
进入Grafana之后,需要先配置之前搭建的Prometheus为数据来源:

点击添加按钮,因为我之前添加过,所以列表中有了一个:

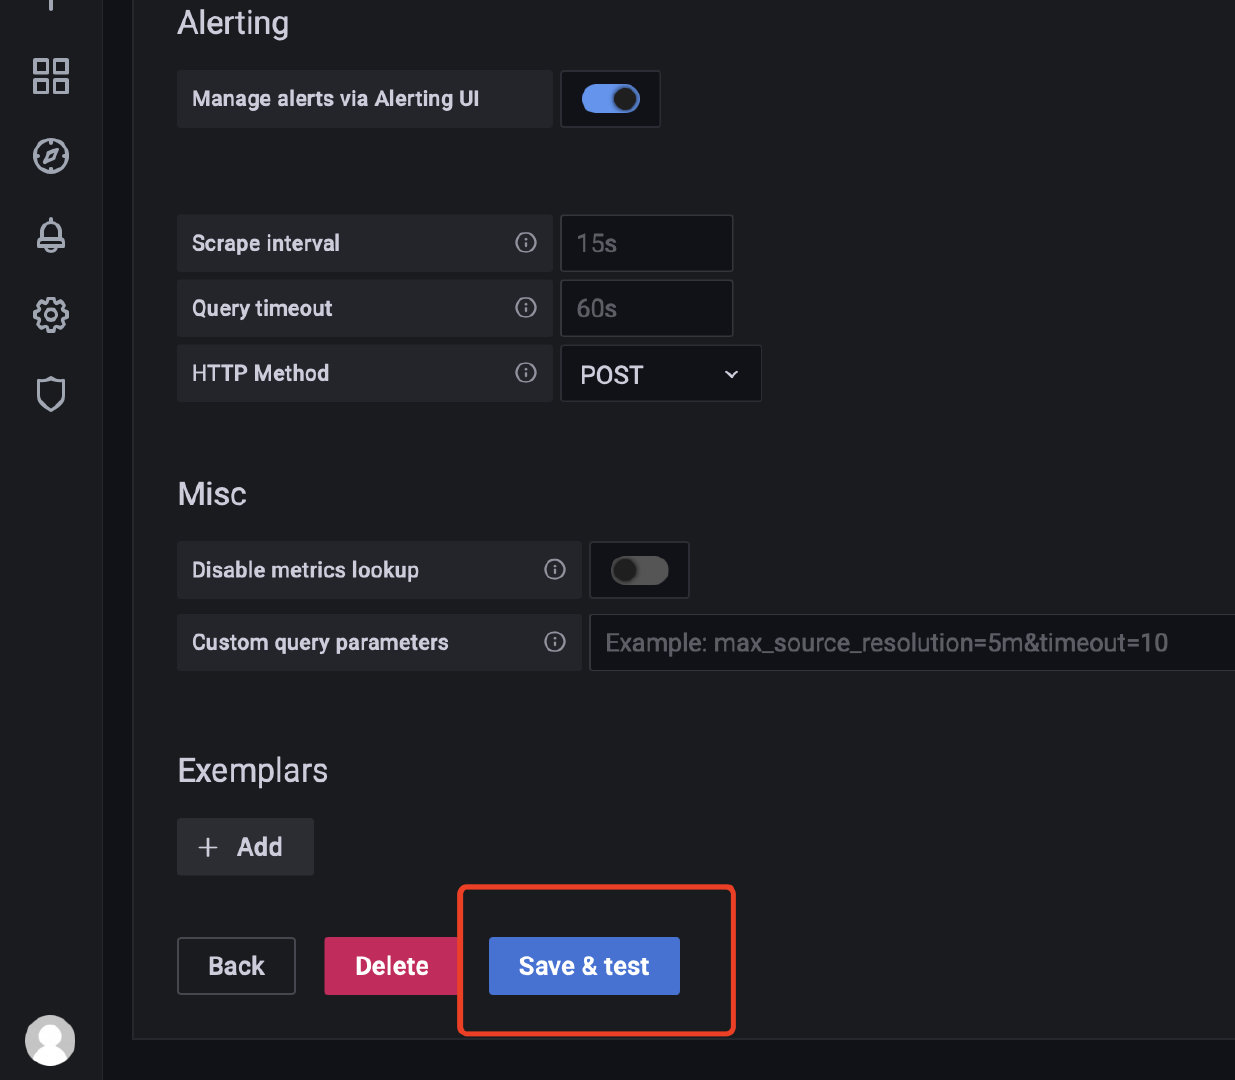
修改名称,填写你的prometheus地址即可:

最后别忘了先测试一下:
配置RocketMQ监控页面

进入管理页面之后,选择导入模版,因为已经有现成的模版,可以直接使用,也可以根据自己的需求自己定制

查看已有的grafana模版:https://grafana.com/grafana/dashboards

之前只有第一个,做得很糟,本来想自己设计了,没想到最近刚有大佬上传一个新的,点击进去之后,复制模版ID

回到Grafana导入界面,输入模板ID:

下一步,选择数据源:

导入之后,大功告成:
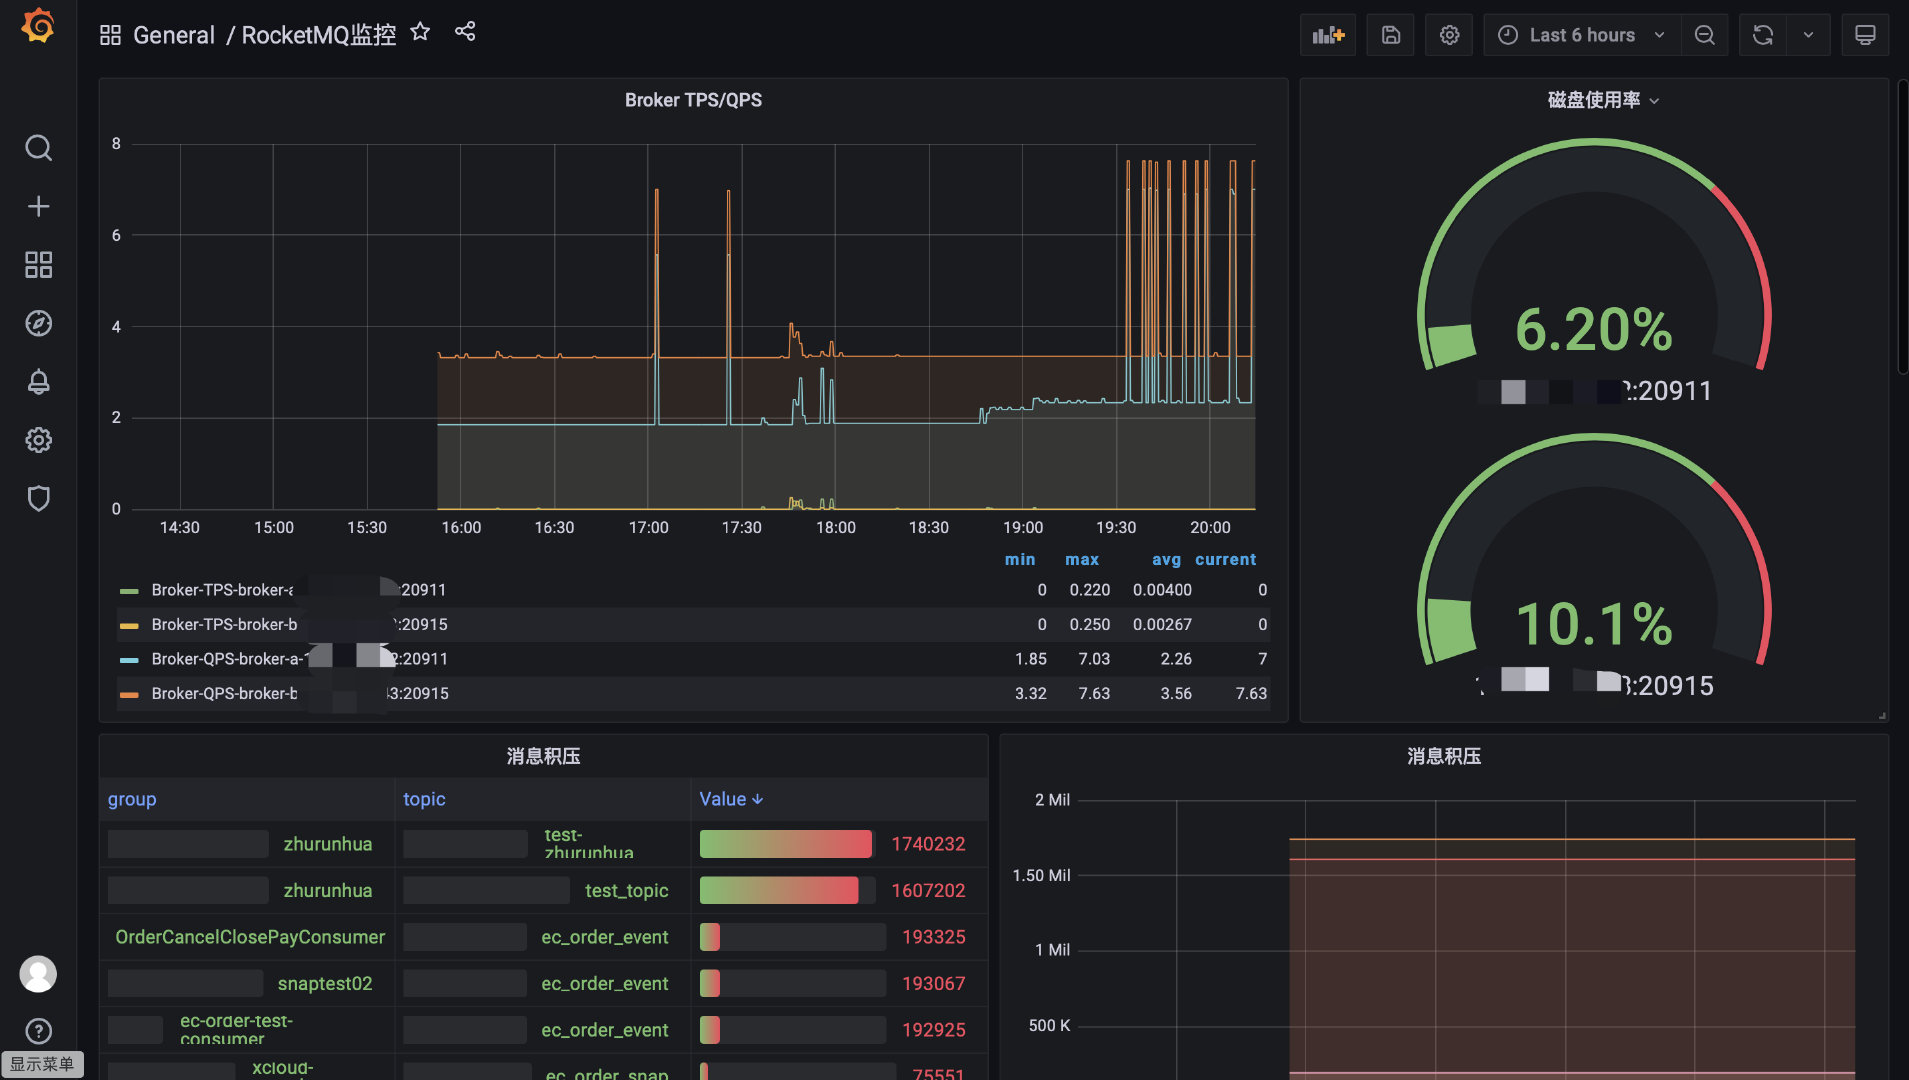
因为是我之前导入的,所以有历史的数据,这个模版就比原来的要直观很多,后续可以根据Prometheus采集到的指标,自定义Panel,根据自己的需求来做监控。