一.安装blackbox_exporter
在我的随笔里面有百度云链接 https://www.cnblogs.com/lc226/p/11222048.html
1.下载解压后 nohup ./blackbox_exporter &
2.查看输出结果 tail -f nohup.out
二.配置prometheus
1.vi prometheus.yml
2.
这里用的icmp模块,,还是一样要注意yml这个文件的格式问题。
- job_name: 'ping'
metrics_path: /probe
params:
module: [icmp] # Look for icmp.
static_configs:
- targets: ['www.baidu.com','172.16.16.74','172.16.16.76']
relabel_configs: -------------------------------------------------------------------这个用法后面有空专门讲
- source_labels: [__address__]
target_label: __param_target
- source_labels: [__param_target]
target_label: instance
- target_label: __address__
replacement: 172.16.16.80:9115 # The blackbox exporter's real hostname:port

3.重启prometheus
4.访问 http://172.16.16.80:9115/。。。。。这里76那台虚拟机没有用
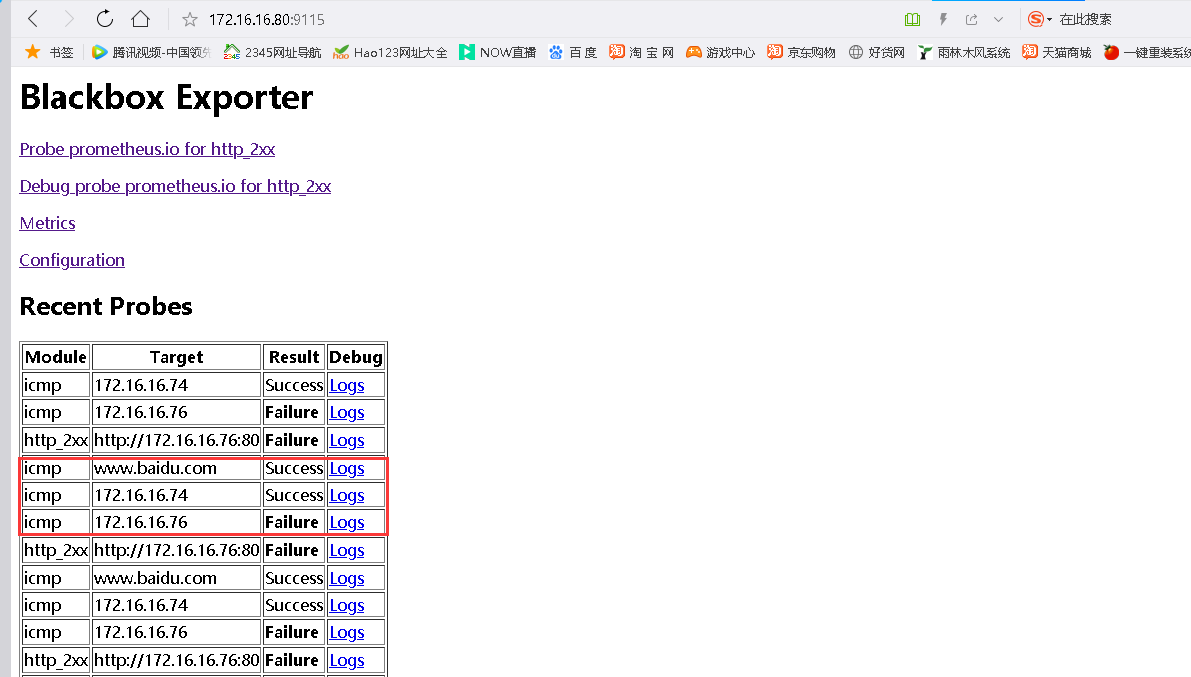
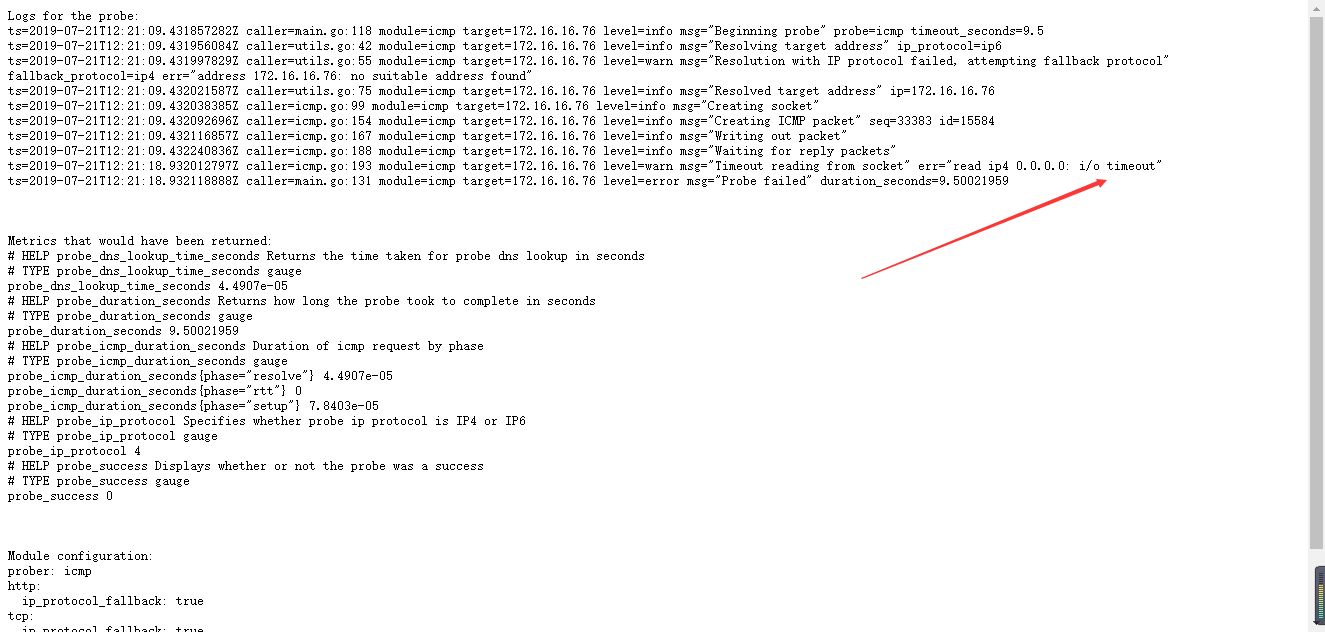
这里如果出现failure可以进去看看是什么原因
比如76那台进去看logs
三。grafana展示
这里是用到 probe_success 这个指标,这个指标表示探测成功就是1失败返回0,这里展示是grafana可以自己设计,具体后面有空再详细解释grafana一些功能

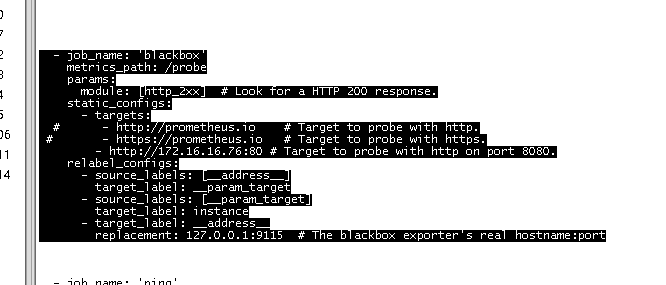
后面再附上http_2xx模块的配置,这个模块可以到测试端口,某一个url具体如下
- job_name: 'blackbox'
metrics_path: /probe
params:
module: [http_2xx] # Look for a HTTP 200 response.
static_configs:
- targets:
# - http://prometheus.io # Target to probe with http.
# - https://prometheus.io # Target to probe with https.
- http://172.16.16.76:80 # Target to probe with http on port 8080.
relabel_configs:
- source_labels: [__address__]
target_label: __param_target
- source_labels: [__param_target]
target_label: instance
- target_label: __address__
replacement: 127.0.0.1:9115 # The blackbox exporter's real hostname:port