import pandas as pd
import numpy as np
import matplotlib.pyplot as plt

fig = plt.figure(1)
ax1 = fig.add_subplot(2,2,1)
ax2 = fig.add_subplot(2,2,2)
ax3 = fig.add_subplot(2,2,3)
ax4 = fig.add_subplot(2,2,4)

df1 = pd.DataFrame(np.random.randn(3,5),columns = ['one','two','three','four','five'])
df2 = pd.DataFrame(np.random.randn(3,5),columns = ['one','two','three','four','five'])
df3 = pd.DataFrame(np.random.randn(3,5),columns = ['one','two','three','four','five'])
df4 = pd.DataFrame(np.random.randn(3,5),columns = ['one','two','three','four','five'])

df1.plot(ax = ax1, title = "df1", grid = 'on')
df2.plot(ax = ax2, title = "df1", grid = 'on')
df3.plot(ax = ax3, title = "df1", grid = 'on')
df4.plot(ax = ax4, title = "df1", grid = 'on')

plt.show()

import pandas as pd
import numpy as np
import matplotlib.pyplot as plt
fig = plt.figure(1)
ax1 = fig.add_subplot(2,2,1)
ax2 = fig.add_subplot(2,2,2)
ax3 = fig.add_subplot(2,2,3)
ax4 = fig.add_subplot(2,2,4)
df1 = pd.DataFrame(np.random.randn(3,5),columns = ['one','two','three','four','five'])
df2 = pd.DataFrame(np.random.randn(3,5),columns = ['one','two','three','four','five'])
df3 = pd.DataFrame(np.random.randn(3,5),columns = ['one','two','three','four','five'])
df4 = pd.DataFrame(np.random.randn(3,5),columns = ['one','two','three','four','five'])
df1.plot(ax = ax1, title = "df1", grid = 'on')
df2.plot(ax = ax2, title = "df1", grid = 'on')
df3.plot(ax = ax3, title = "df1", grid = 'on')
df4.plot(ax = ax4, title = "df1", grid = 'on')
ax1.legend_.remove()
ax2.legend_.remove()
ax3.legend_.remove()
plt.show()

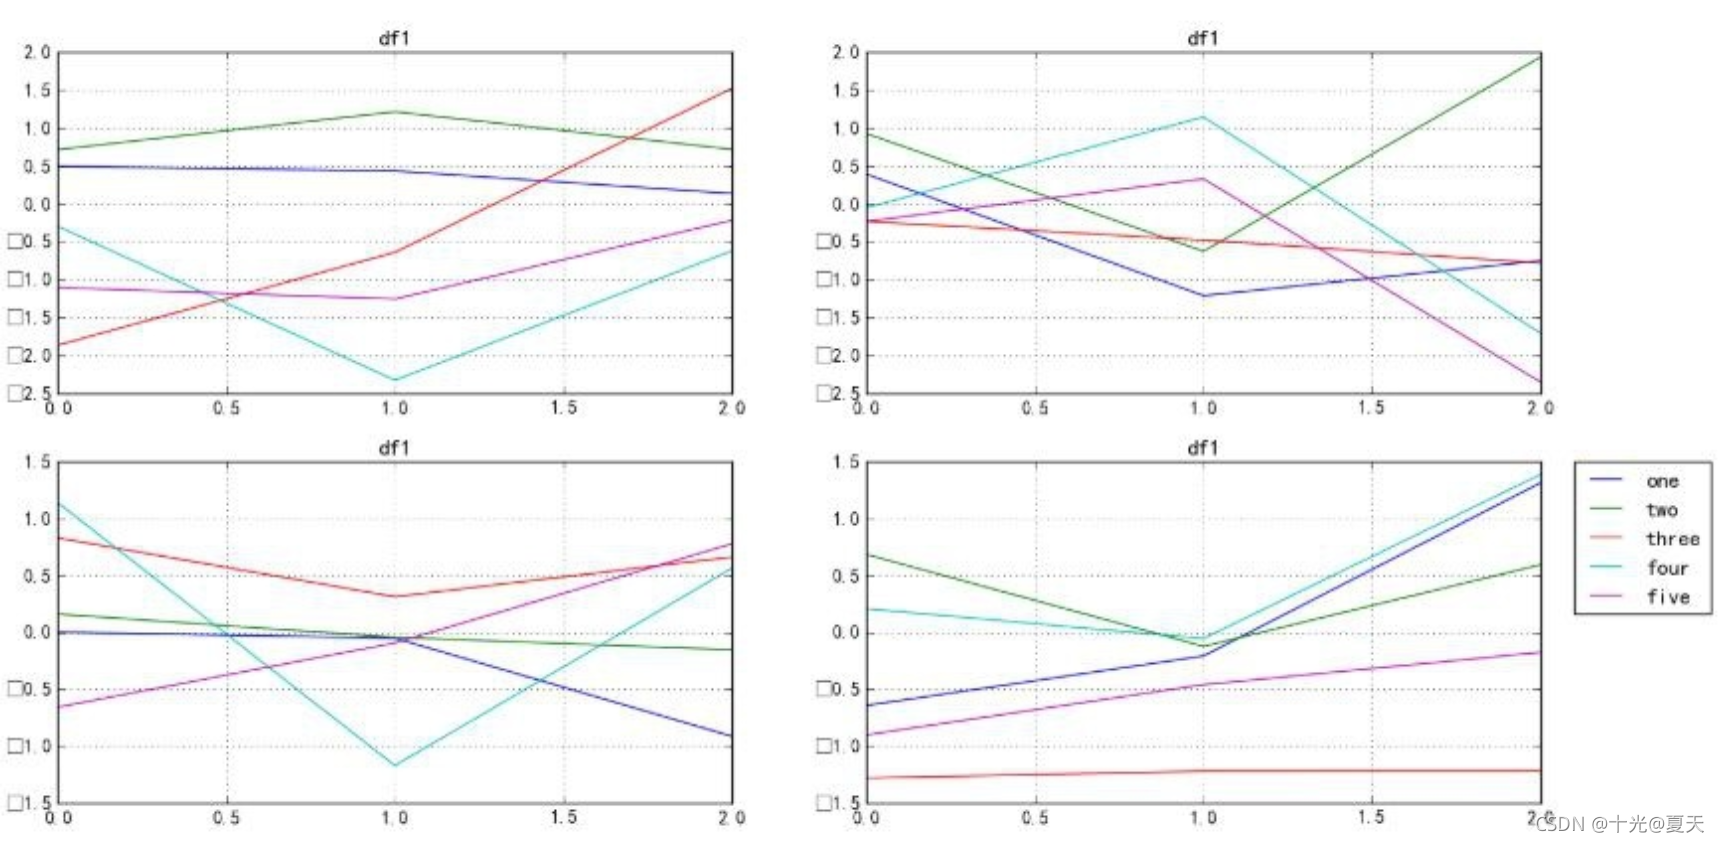
import pandas as pd
import numpy as np
import matplotlib.pyplot as plt
fig = plt.figure(1)
ax1 = fig.add_subplot(2,2,1)
ax2 = fig.add_subplot(2,2,2)
ax3 = fig.add_subplot(2,2,3)
ax4 = fig.add_subplot(2,2,4)
df1 = pd.DataFrame(np.random.randn(3,5),columns = ['one','two','three','four','five'])
df2 = pd.DataFrame(np.random.randn(3,5),columns = ['one','two','three','four','five'])
df3 = pd.DataFrame(np.random.randn(3,5),columns = ['one','two','three','four','five'])
df4 = pd.DataFrame(np.random.randn(3,5),columns = ['one','two','three','four','five'])
df1.plot(ax = ax1, title = "df1", grid = 'on')
df2.plot(ax = ax2, title = "df1", grid = 'on')
df3.plot(ax = ax3, title = "df1", grid = 'on')
df4.plot(ax = ax4, title = "df1", grid = 'on')
ax1.legend_.remove()
ax2.legend_.remove()
ax3.legend_.remove()
ax4.legend(loc=2, bbox_to_anchor=(1.05,1.0),borderaxespad = 0.)
plt.show()