import matplotlib.pyplot as plt遍历迭代器
def drawLoss(train_loss,test_loss):
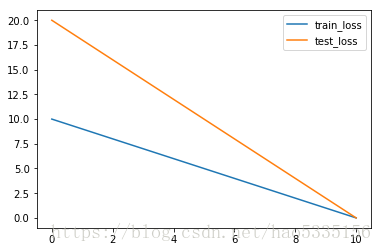
plt.plot(train_loss, label='train_loss')
plt.plot(test_loss, label='test_loss')
plt.legend()
plt.show()将迭代器转list
train_loss=list(range(10,-1,-1))
test_loss=list(range(20,-1,-2))train_loss[10, 9, 8, 7, 6, 5, 4, 3, 2, 1, 0]
test_loss[20, 18, 16, 14, 12, 10, 8, 6, 4, 2, 0]
drawLoss(train_loss,test_loss)