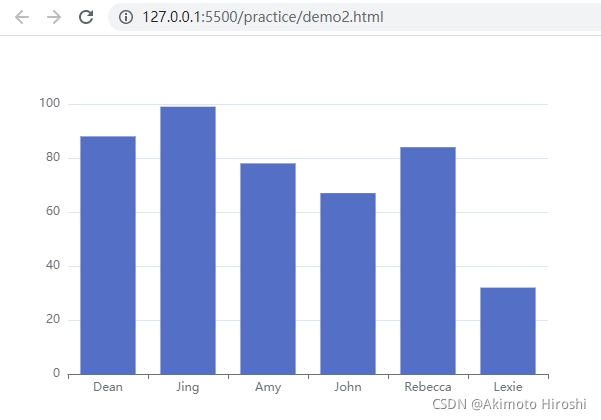
先画一个基本的图表:
<!DOCTYPE html>
<html lang="en">
<head>
  <meta charset="UTF-8">
  <meta http-equiv="X-UA-Compatible" content="IE=edge">
  <meta name="viewport" content="width=device-width, initial-scale=1.0">
  <title>柱状图的基本实现和常见效果</title>
  <script src="https://cdn.bootcdn.net/ajax/libs/echarts/5.0.2/echarts.common.min.js"></script>
</head>
<body>
  <div style="width: 600px; height: 400px;"></div>
  <script>
    var myCharts = echarts.init(document.querySelector('div'))
    var xDataArr = ['Dean', 'Jing', 'Amy', 'John', 'Rebecca', 'Lexie']
    var yDataArr = [88, 99, 78, 67, 84, 32]
    var option = {


      xAxis: {


        type: 'category',
        data: xDataArr
      },
      yAxis: {


        type: 'value'
      },
      series: [
        {


          name: 'Math',
          type: 'bar',
          data: yDataArr
        }
      ]
    }
    myCharts.setOption(option)
  </script>
</body>
</html>
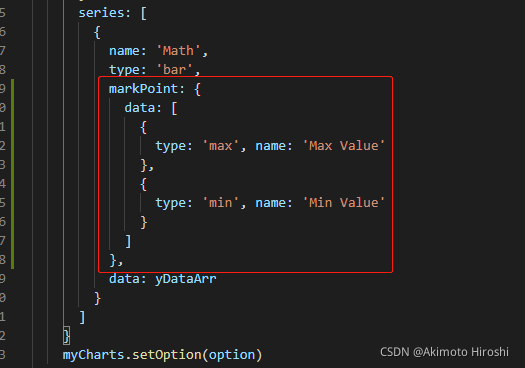
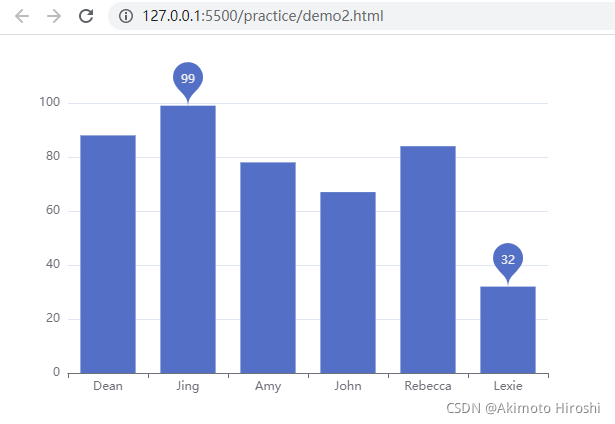
markPoint:
ECharts 提供的标记类型包括
‘circle’, ‘rect’, ‘roundRect’, ‘triangle’, ‘diamond’, ‘pin’, ‘arrow’, ‘none’
可以通过 ‘image://url’ 设置为图片,其中 URL 为图片的链接,或者 dataURI。
URL 为图片链接例如:

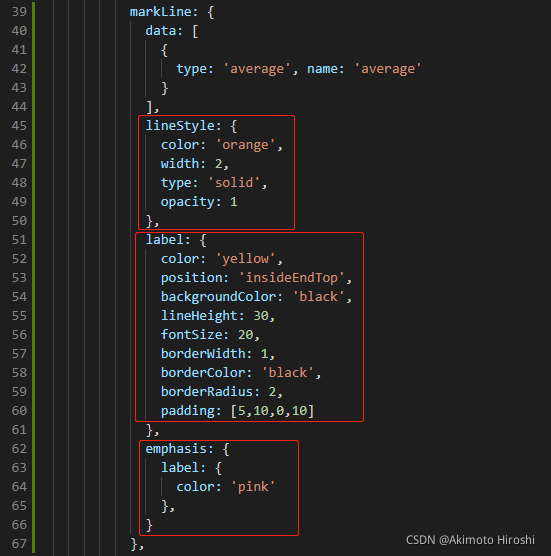
markLine:
<!DOCTYPE html>
<html lang="en">
<head>
  <meta charset="UTF-8">
  <meta http-equiv="X-UA-Compatible" content="IE=edge">
  <meta name="viewport" content="width=device-width, initial-scale=1.0">
  <title>柱状图的基本实现和常见效果</title>
  <script src="https://cdn.bootcdn.net/ajax/libs/echarts/5.0.2/echarts.common.min.js"></script>
</head>
<body>
  <div style="width: 600px; height: 400px;"></div>
  <script>
    var myCharts = echarts.init(document.querySelector('div'))
    var xDataArr = ['Dean', 'Jing', 'Amy', 'John', 'Rebecca', 'Lexie']
    var yDataArr = [88, 99, 78, 67, 84, 32]
    var option = {


      xAxis: {


        type: 'category',
        data: xDataArr
      },
      yAxis: {


        type: 'value'
      },
      series: [
        {


          name: 'Math',
          type: 'bar',
          markPoint: {


            data: [
              {


                type: 'max', name: 'Max Value'
              },
              {


                type: 'min', name: 'Min Value'
              }
            ]
          },
          markLine: {


            data: [
              {


                type: 'average', name: 'average'
              }
            ],
            lineStyle: {


              color: 'orange',
              width: 2,
              type: 'solid',
              opacity: 1
            },
            label: {


              color: 'yellow',
              position: 'insideEndTop',
              backgroundColor: 'black',
              lineHeight: 30,
              fontSize: 20,
              borderWidth: 1,
              borderColor: 'black',
              borderRadius: 2,
              padding: [5,10,0,10]
            },
            emphasis: {


              label: {


                color: 'pink'
              },
            }
          },
          data: yDataArr
        }
      ]
    }
    myCharts.setOption(option)
  </script>
</body>
</html>
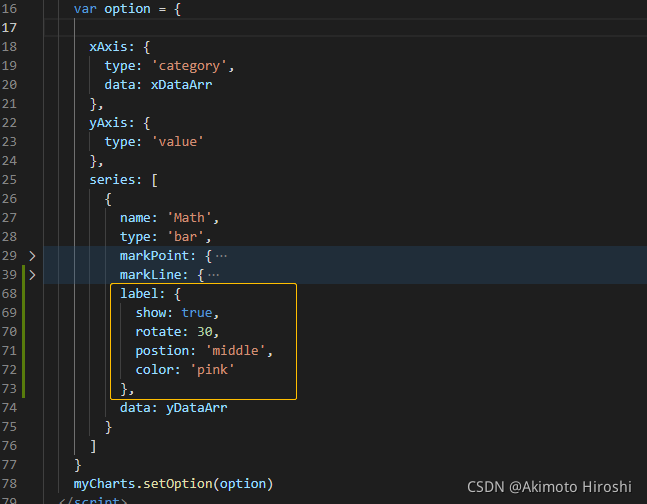
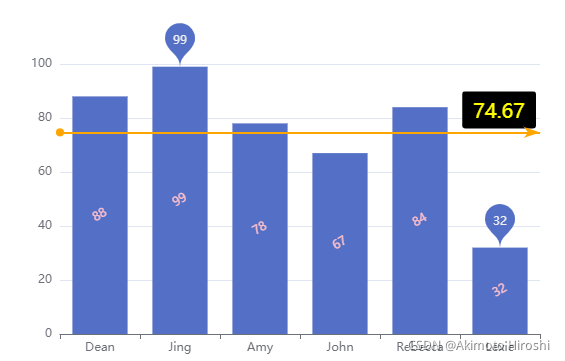
下面这种效果就是设置了:

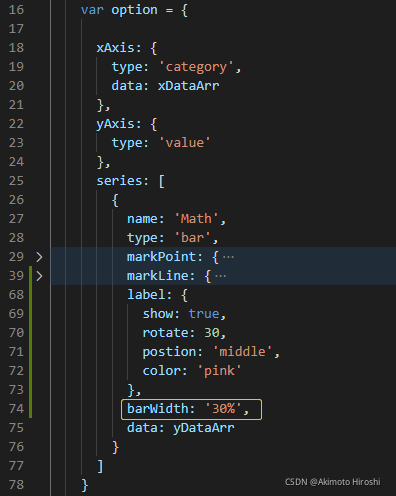
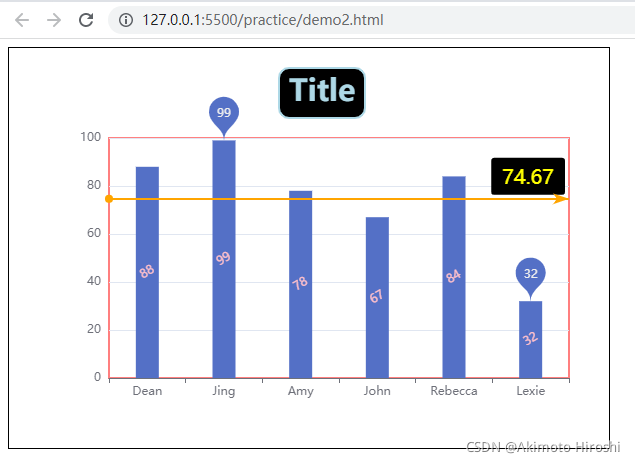
想要显示每个柱状图的值:
想要设置每个柱状图的宽度:

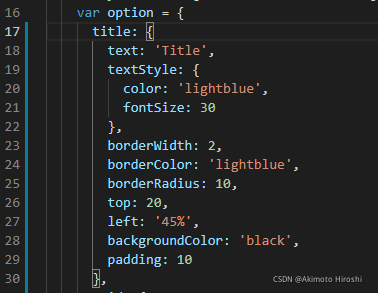
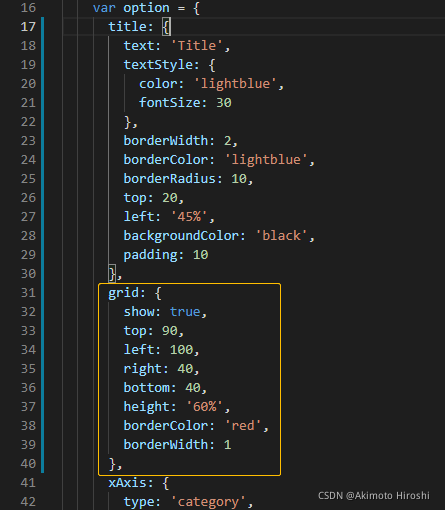
设置标题
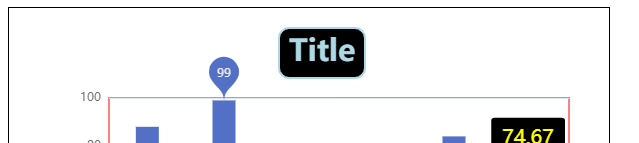
设置grid位置
扫描二维码关注公众号,回复:
13424334 查看本文章

完整代码
<!DOCTYPE html>
<html lang="en">
<head>
  <meta charset="UTF-8">
  <meta http-equiv="X-UA-Compatible" content="IE=edge">
  <meta name="viewport" content="width=device-width, initial-scale=1.0">
  <title>柱状图的基本实现和常见效果</title>
  <script src="https://cdn.bootcdn.net/ajax/libs/echarts/5.0.2/echarts.common.min.js"></script>
</head>
<body>
  <div style="width: 600px; height: 400px; border: 1px solid black;"></div>
  <script>
    var myCharts = echarts.init(document.querySelector('div'))
    var xDataArr = ['Dean', 'Jing', 'Amy', 'John', 'Rebecca', 'Lexie']
    var yDataArr = [88, 99, 78, 67, 84, 32]
    var option = {


      title: {


        text: 'Title',
        textStyle: {


          color: 'lightblue',
          fontSize: 30
        },
        borderWidth: 2,
        borderColor: 'lightblue',
        borderRadius: 10,
        top: 20,
        left: '45%',
        backgroundColor: 'black',
        padding: 10
      },
      grid: {


        show: true,
        top: 90,
        left: 100,
        right: 40,
        bottom: 40,
        height: '60%',
        borderColor: 'red',
        borderWidth: 1
      },
      xAxis: {


        type: 'category',
        data: xDataArr
      },
      yAxis: {


        type: 'value'
      },
      series: [
        {


          name: 'Math',
          type: 'bar',
          markPoint: {


            data: [
              {


                type: 'max', name: 'Max Value'
              },
              {


                type: 'min', name: 'Min Value'
              }
            ]
          },
          markLine: {


            data: [
              {


                type: 'average', name: 'average'
              }
            ],
            lineStyle: {


              color: 'orange',
              width: 2,
              type: 'solid',
              opacity: 1
            },
            label: {


              color: 'yellow',
              position: 'insideEndTop',
              backgroundColor: 'black',
              lineHeight: 30,
              fontSize: 20,
              borderWidth: 1,
              borderColor: 'black',
              borderRadius: 2,
              padding: [5,10,0,10]
            },
            emphasis: {


              label: {


                color: 'pink'
              },
            }
          },
          label: {


            show: true,
            rotate: 30,
            postion: 'middle',
            color: 'pink'
          },
          barWidth: '30%',
          data: yDataArr
        }
      ]
    }
    myCharts.setOption(option)
  </script>
</body>
</html>