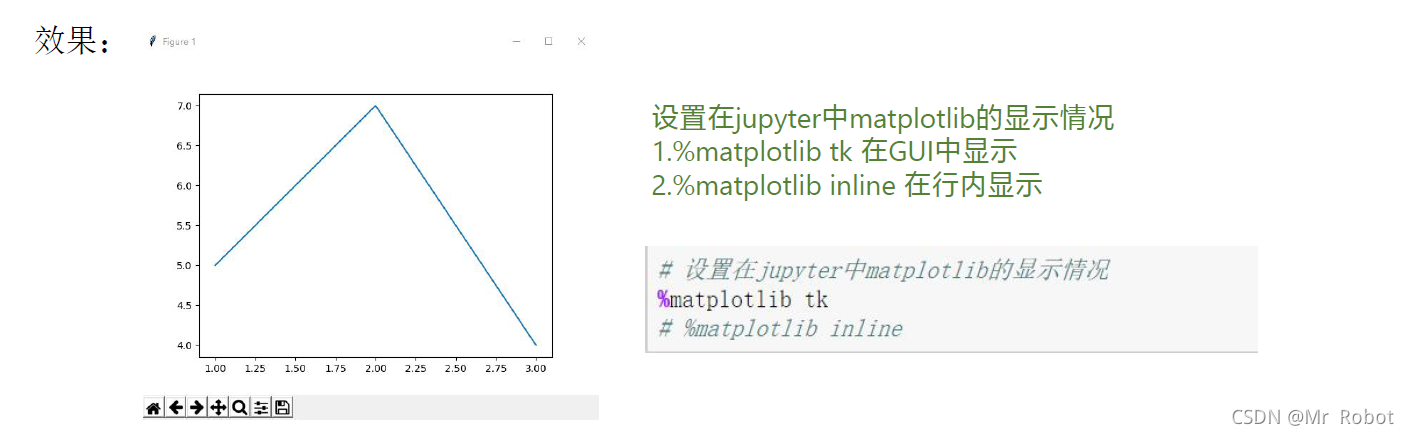
Python最常用的绘图库,提供了一整套十分适合交互式绘图的命令
API,比较方便的就可以将其嵌入到GUI应用程序中。
官网:http://matplotlib.org/
学习方式:从官网examples入门学习
http://matplotlib.org/examples/index.html
http://matplotlib.org/gallery.html
为什么选择Matplotlib
1.Matplotlib 是一个非常强大的 Python 画图工具.
2.手中有很多数据, 可是不知道该怎么呈现这些数据.
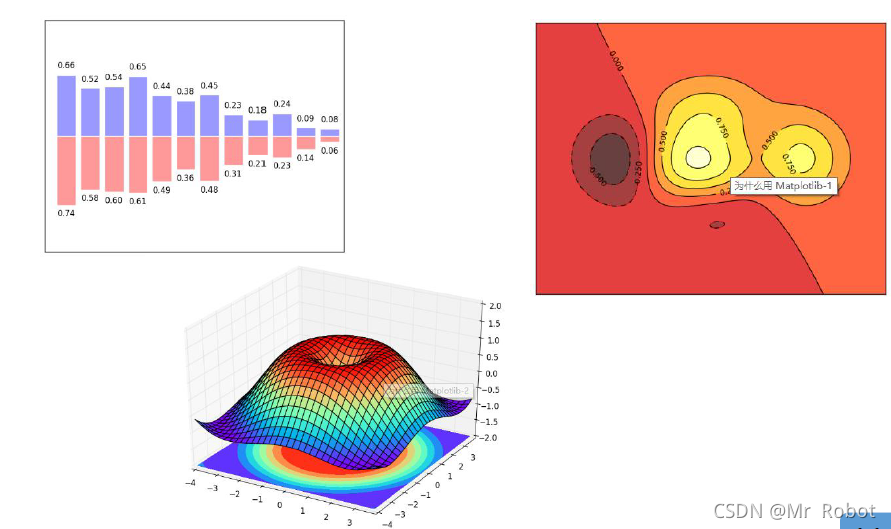
Matplotlib它能帮你画出美丽的:
线图;
散点图;
等高线图;
条形图;
柱状图;
3D 图形,
甚至是图形动画等等.
基本使用

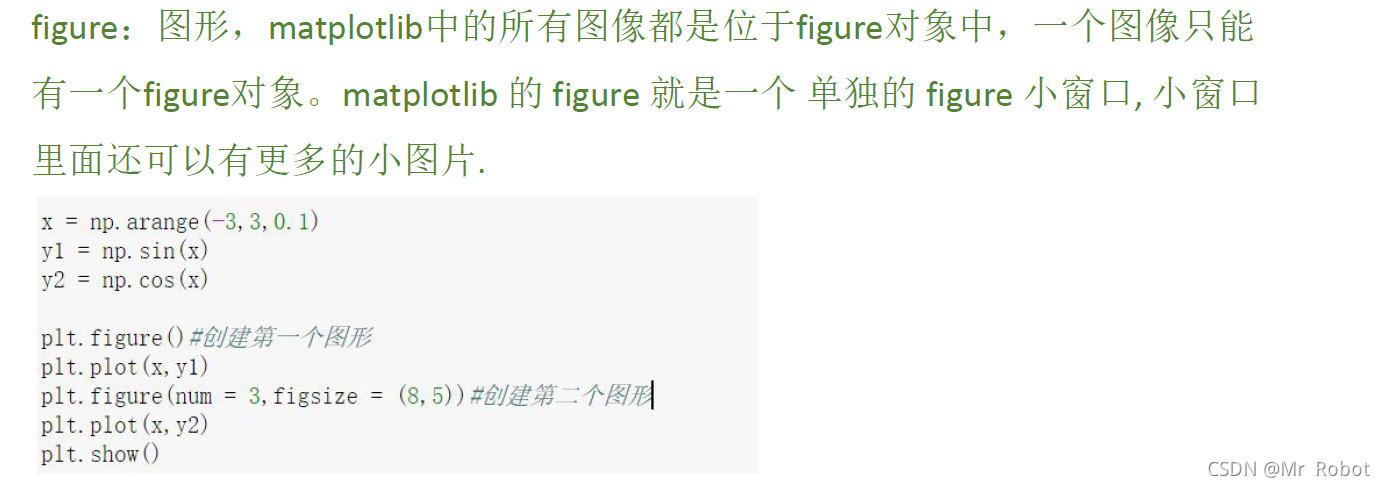
matplotlib:图形 figure
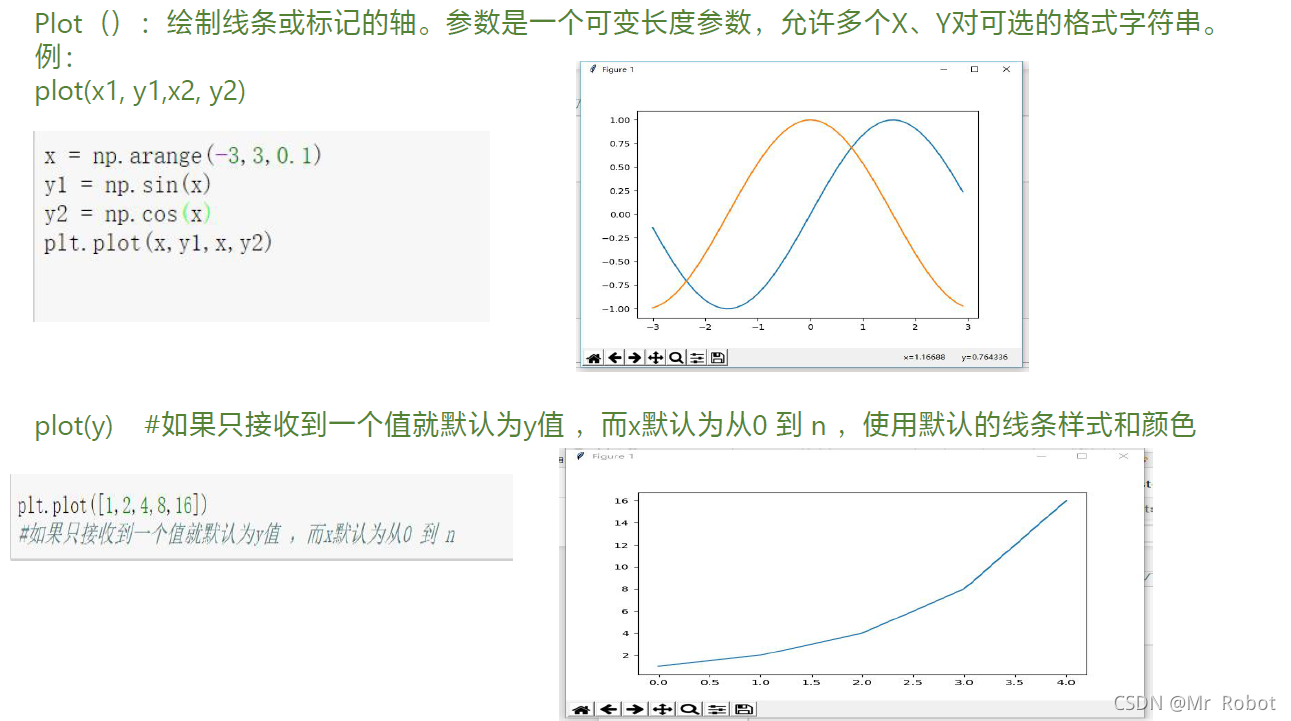
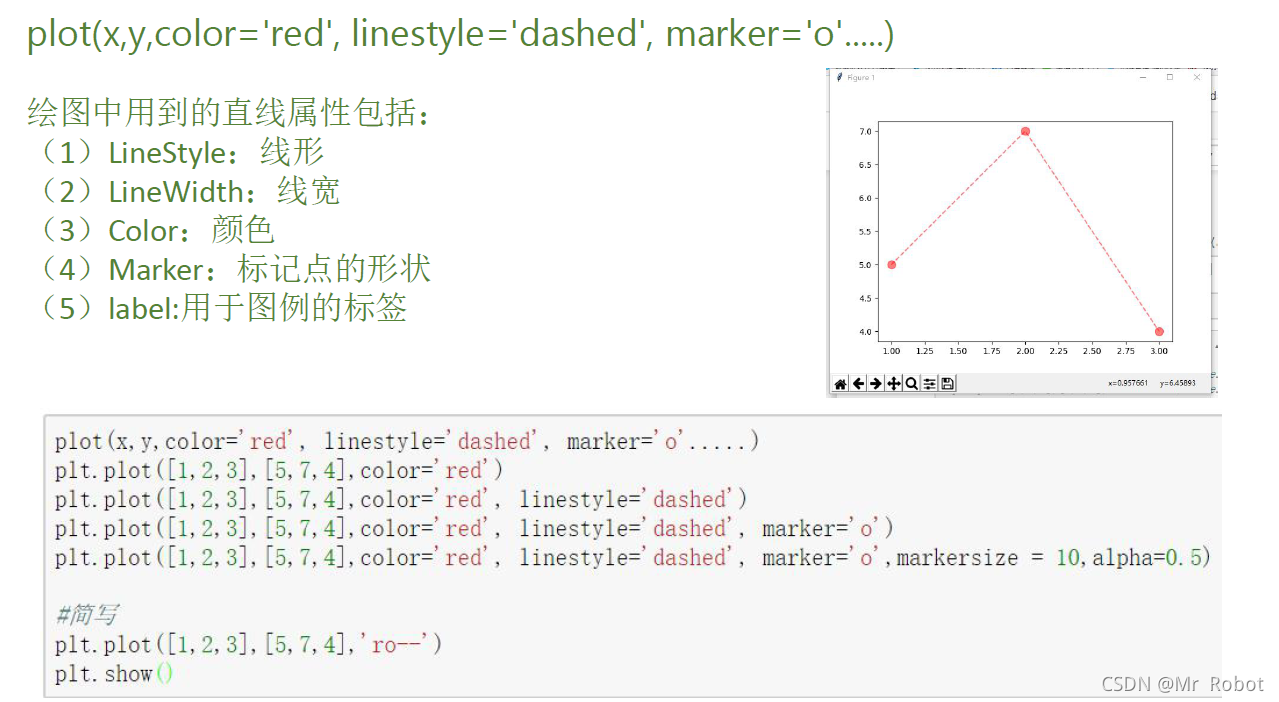
matplotlib:颜色、标记和线型
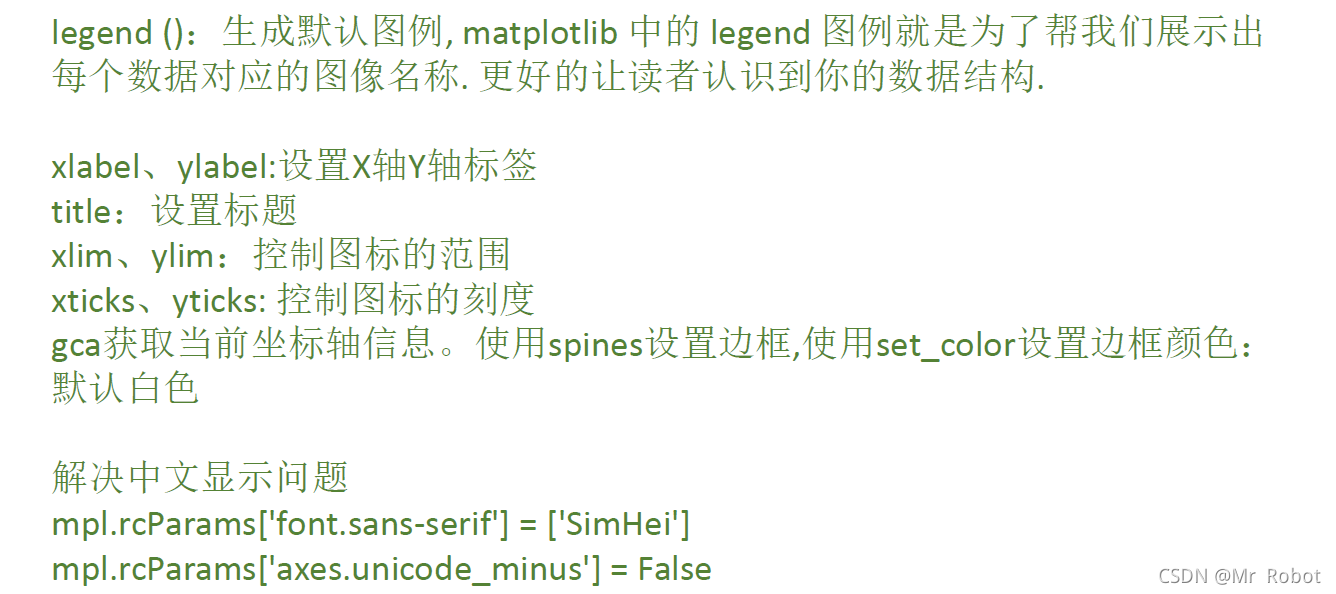
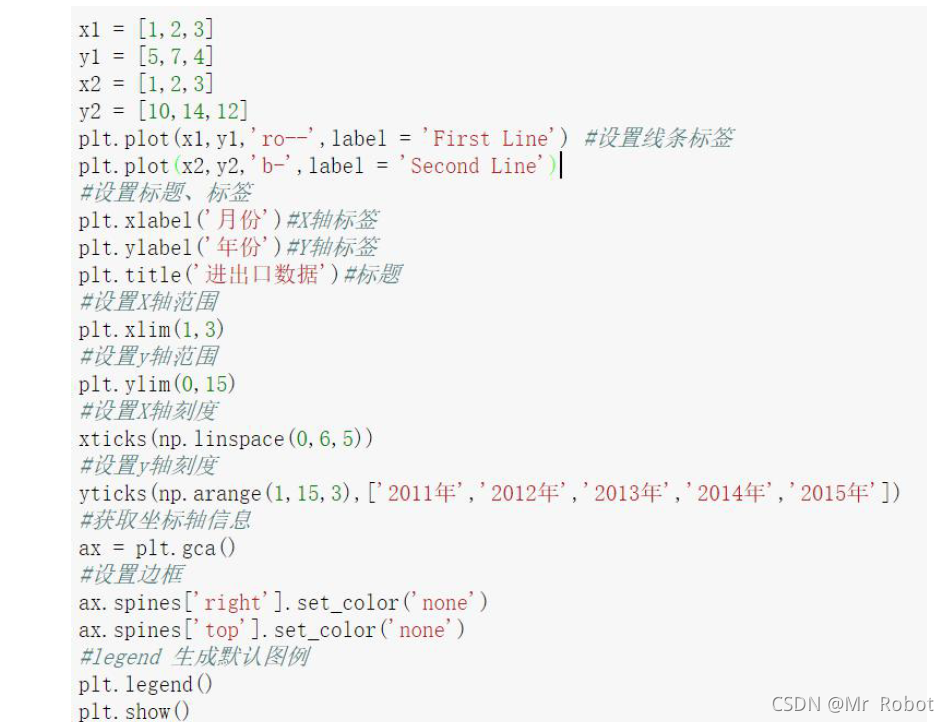
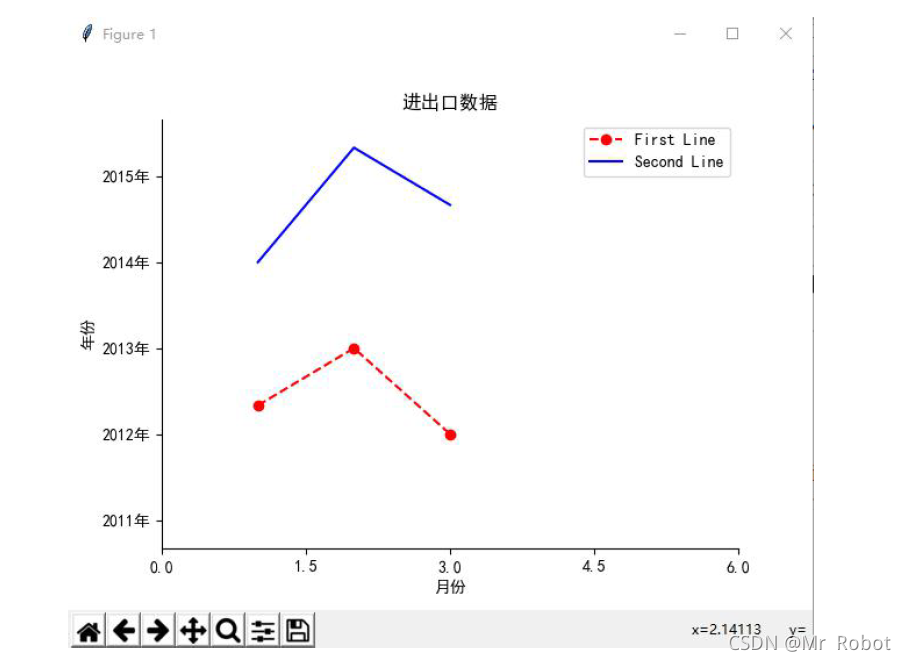
matplotlib:刻度、标题、标签和图例
Matplotlib:Subplot 子图
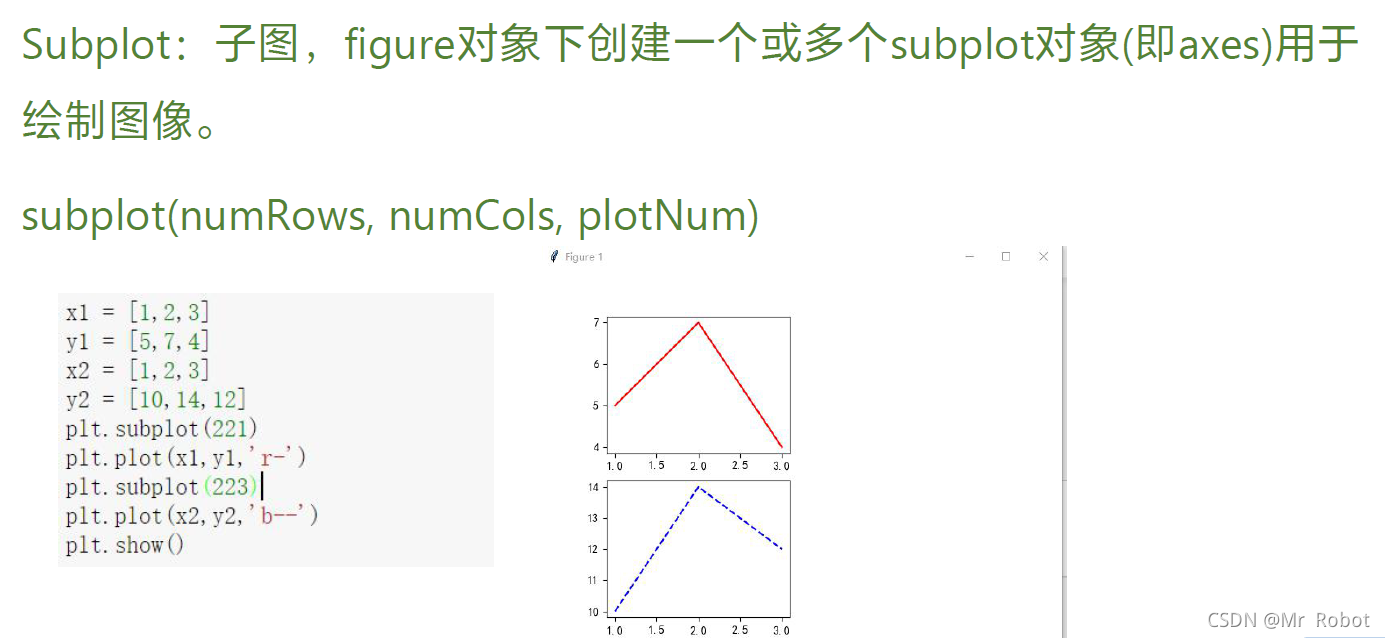
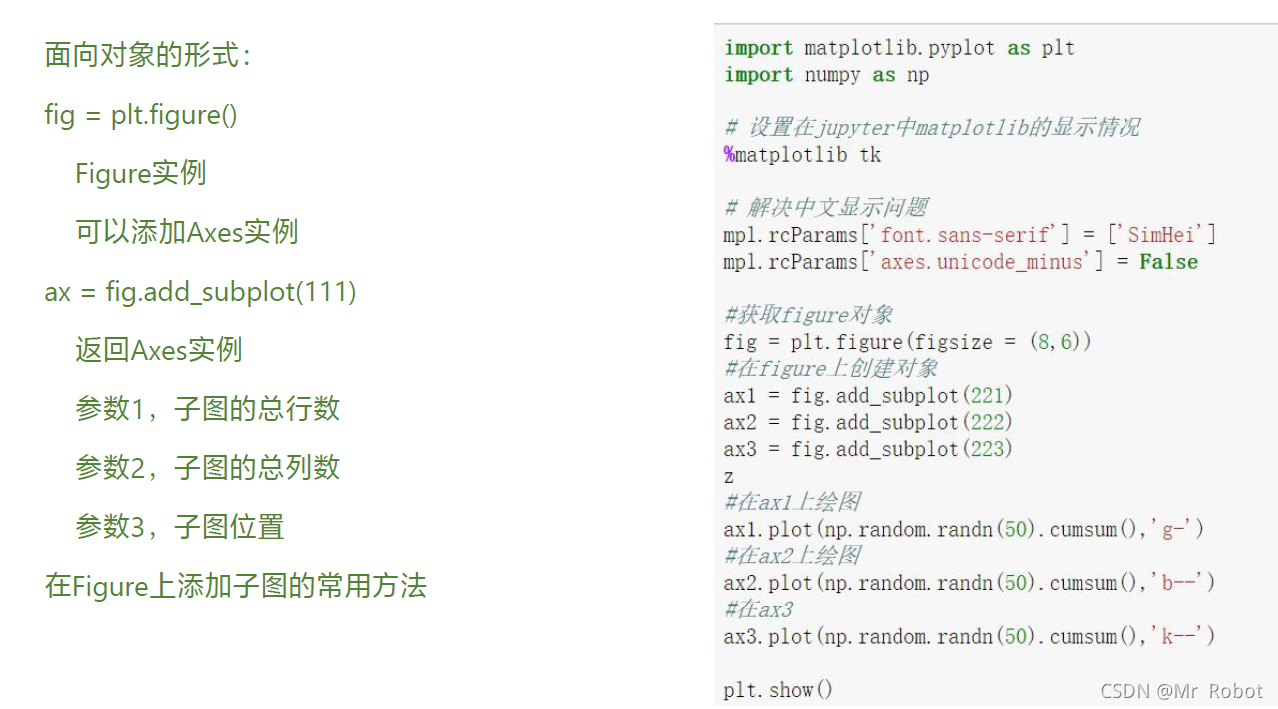
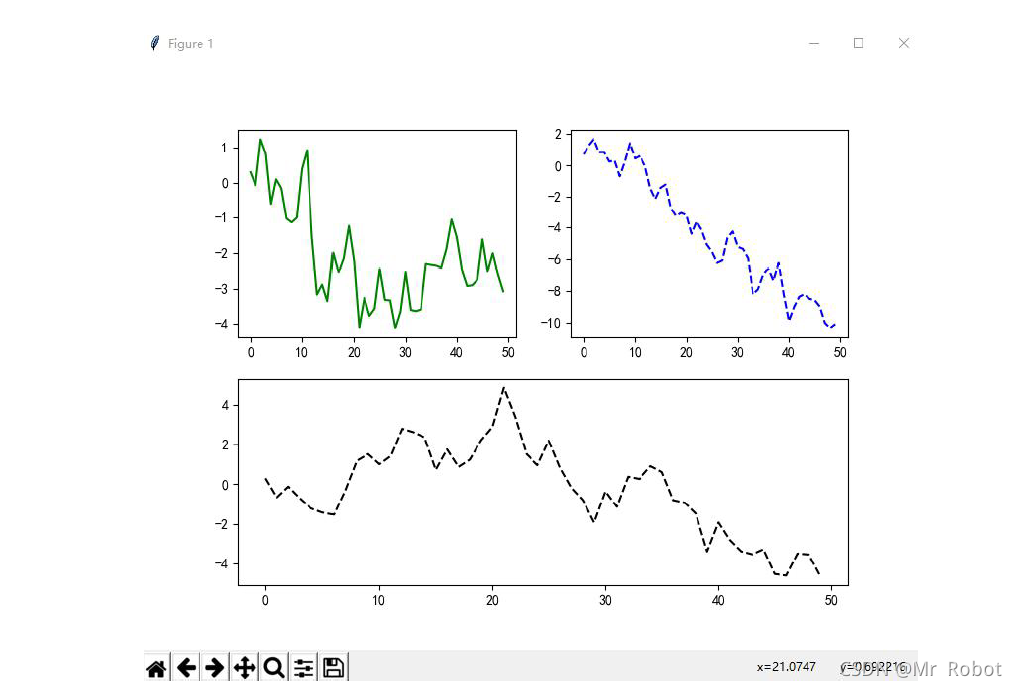
Figure和Subplot
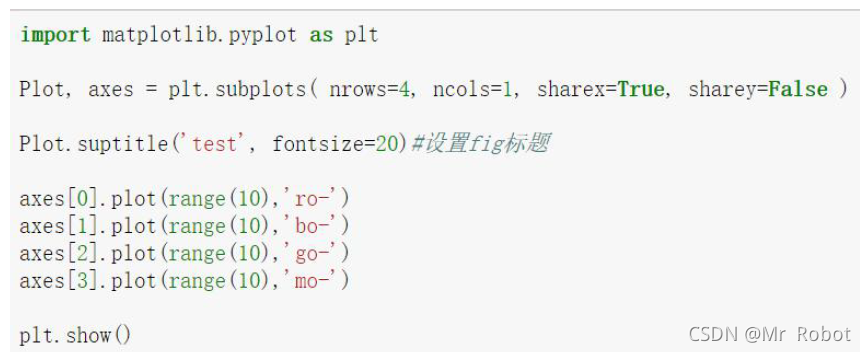
Sublots():返回一个图像和多个子图
参数: nrows=x, ncols=x, sharex=True, sharey=False,
gridspec_kw={‘height_ratios’:[2,2,1,1]}
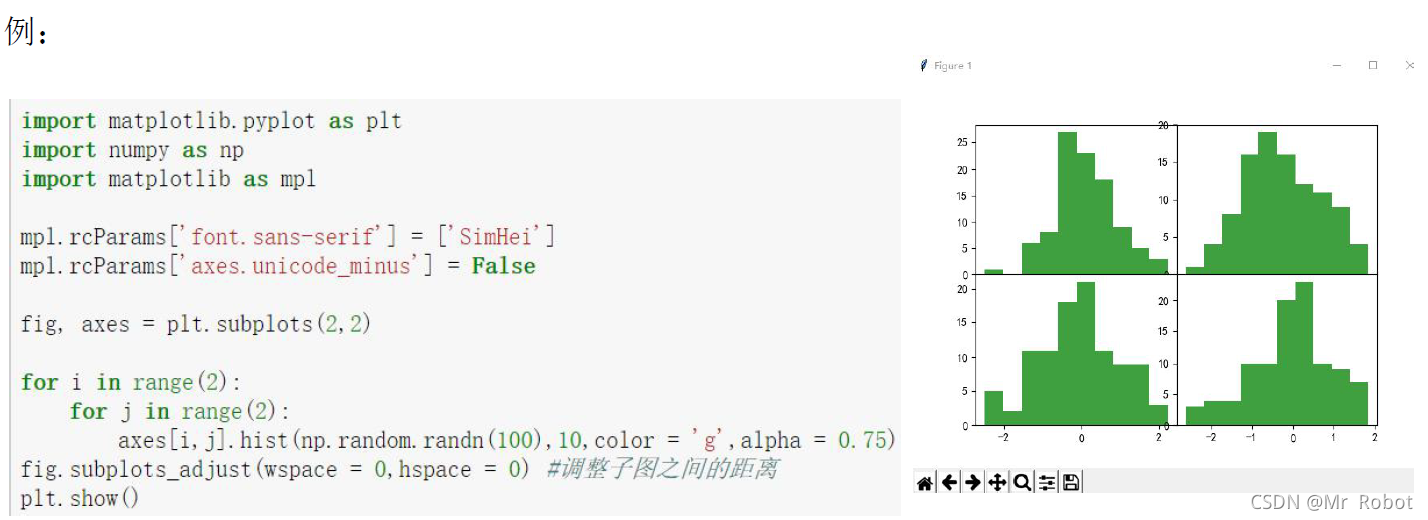
例:
fig, ax = plt.subplots(2,2),其中参数分别代表子图的行数和列数,一共有 2x2 个图像。函数返回一个figure图像和一个子图ax的array列表。
matplotlib:图像保存文件
