写作目标
Java程序运行过程中,难免会出现 OOM,往往是在 JVM 启动参数中添加出现 OOM 时输出堆 dump(又名:堆转储、堆快照)的参数,就在昨天下午我司生产环境出现 OOM,生成的堆 dump 有 16 个G,压缩后传回本地,想分析时犯了难——本地开发机 16G 内存,用 MAT 打不开!
通过查询相关文档,发现可以使用 MAT 命令行脚本生成可供 MAT 图形化界面展示的文件,也就是 用 Linux 服务器进行分析大堆/超大堆 dump 文件,输出分析报告,通过浏览器直接查看!
运行环境
- CentOS 7.4
- MemoryAnalyzer-1.10.0.20200225-linux.gtk.x86_64.zip
- 16G堆dump
- 开发机Win10,16G内存
MAT 下载地址 http://www.eclipse.org/mat/downloads.php
操作步骤
1 上传并解压 MAT 到服务器
上传 MAT 压缩包到服务器上

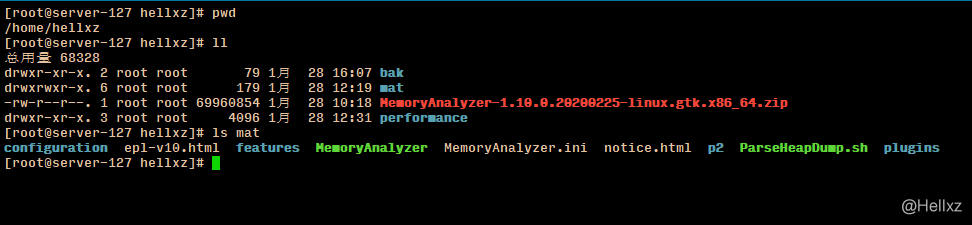
解压缩到Home目录
unzip -q Memory*.zip -d /home/hellxz
2 上传堆 dump 文件到服务器
生产环境打堆 dump 及压缩,仅作演示,我这边是自动打出来的。
# 生成堆 dump
jmap -dump:format=b,file=heap_dump_20210128-1505.hprof 10532
# 压缩堆 dump
tar zcf /data/heap_dump_20210128-1505.tar.gz \
        heap_dump_20210128-1505.hprof
tar.gz压缩16G的堆dump仅占 4.77G,这里上传到了 MAT 分析服务器 /home/hellxz/performance 目录下
cd performance
tar zxf heap_dump_20210128-1505.tar.gz

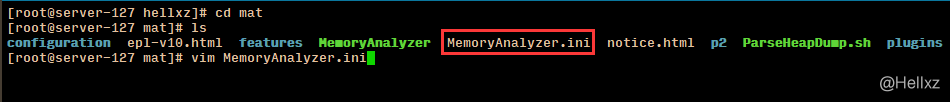
3 调整 MAT 配置文件
cd /home/hellxz/mat
ls
vim MemoryAnalyzer.ini
-startup
plugins/org.eclipse.equinox.launcher_1.5.0.v20180512-1130.jar
--launcher.library
plugins/org.eclipse.equinox.launcher.gtk.linux.x86_64_1.1.700.v20180518-1200
-vmargs
-Xms30g
-Xmx58g
-XX:+UseG1GC
-DhprofStrictnessWarning=true
-vmargs下边是指定JVM参数的地方,默认的-Xmx1024m太小了,另外,我这个堆实在太大,试了好多遍,发现58g左右才不会溢出……如果在后续操作中出现报错为heap space而停止分析,说明堆内存小了,改它!-DhprofStrictnessWarning=true参数最好加上,防止因为某些不必要的提示停止分析
4 执行 MAT 分析堆dump
cd /home/hellxz/mat
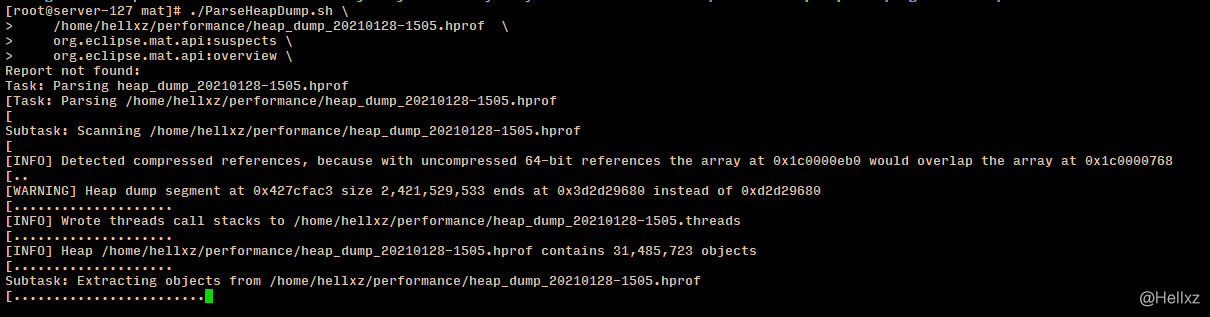
#执行 MAT 命令行脚本
./ParseHeapDump.sh \
/home/hellxz/performance/heap_dump_20210128-1505.hprof \
org.eclipse.mat.api:suspects \
org.eclipse.mat.api:overview \
org.eclipse.mat.api:top_components
- MAT 会将文件分析文件与临时文件输出到堆 dump 目录下,临时文件中包含 .index 结尾的索引文件,首次分析会建立索引速度较慢,后续再执行其他任务就很快了
suspects/overview/top_componets这几个 API 与 MAT 界面上显示的区域是一致的,对应这个命令中是 3 个任务,即生成名为xxx_Leak_Suspects.zip/xxx_System_Overview.zip/xxx_Top_Components.zip的分析报告,可选择分析三者任几个任务- 如执行出现错误,请去文末查找错误解决方法
MAT 分析时间较长,等待一段时间后,能得到三个 zip 压缩包
xxx_Leak_Suspects.zip / xxx_System_Overview.zip / xxx_Top_Components.zip,xxx 会被替换为堆 dump 的名称

5 使用浏览器查看报告
将 xxx_Leak_Suspects.zip / xxx_System_Overview.zip / xxx_Top_Components.zip 三个压缩包下载到本地,分别解压,双击 index.html 使用浏览器查看即可。
如图,打开了 Leak_Suspects 解压的 index.html
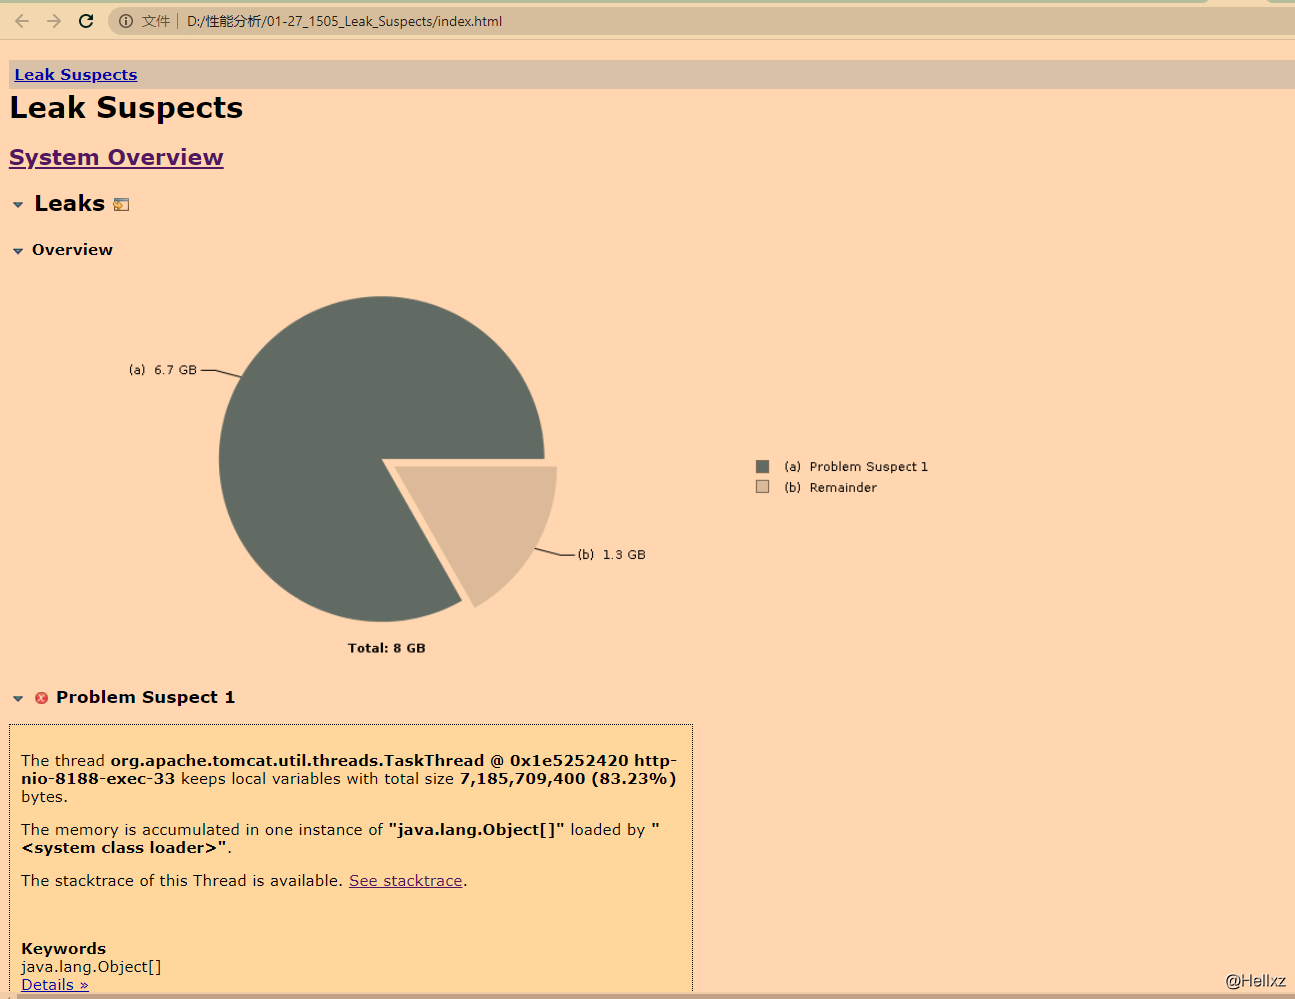
真不是我屏幕黄,是校色工具搞的……
Q&A
1 提示X11转发打开窗口
取消打开窗口则报错: java.lang.InternalError: Can't connect to X11 window server using 'localhost:10.0' as the value of the DISPLAY variable.
解决办法:
echo "export DISPLAY=:1" /etc/profile
source /etc/profile
对于安装了桌面的临时处理办法,用完后修改回来,如果没装桌面就不用改回来了
2 提示 heap space,停止分析
设置mat目录下的 MemoryAnalyzer.ini,在 -vmargs 下调整JVM最大堆大小
3 提示 Unable to initialize GTK+
ParseHeapDump.sh 执行时调用了GTK的组件,当前OS环境不满足就会报错,解决方式是绕过GTK组件:
1)获取启动包路径
cd mat
ls plugins/org.eclipse.equinox.launcher*.jar
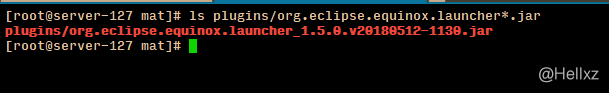
复制红字部分,一会改脚本需要用
2)修改 ParseHeapDump.sh
cd mat
vim ParseHeapDump.sh
注释第11行,添加新的启动命令
java -Xmx16g -DhprofStrictnessWarning=true -jar \
     "$(dirname -- "$0")"/plugins/org.eclipse.equinox.launcher_1.5.0.v20180512-1130.jar \
-consolelog -application org.eclipse.mat.api.parse "$@"
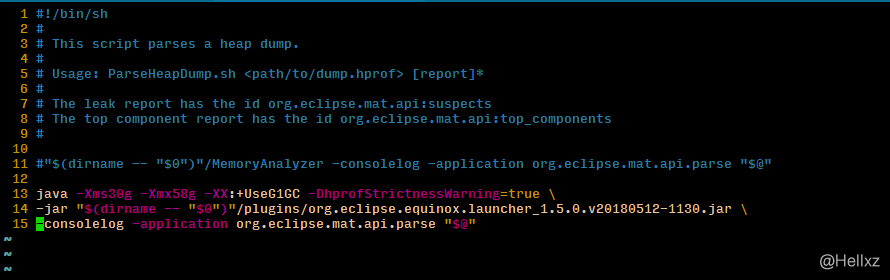
-jar前为自定义JVM参数plugins/org.eclipse.equinox.launcher_1.5.0.v20180512-1130.jar请替换为第一步中获取的jar包名
未经许可禁止转载,如需转载请注明出处!https://blog.csdn.net/u012586326/article/details/113337422